Preprints
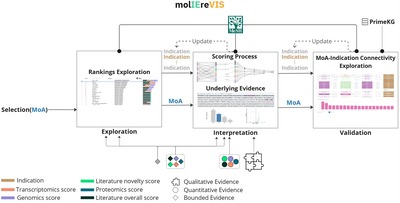
molIEreVIS: Exploring and Interpreting the Evidence Behind Drug Repurposing Predictions
frontiers, 2026
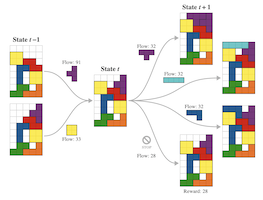
GFlowNet Playground - Theory and Examples for an Intuitive Understanding
Workshop on Visualization for AI Explainability, 2025
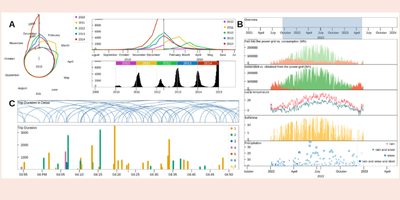
time-i-gram: A Grammar for Interactive Visualization of Time-based Data
OSF Preprints, 2024
Peer-Reviewed Journal and Conference Papers
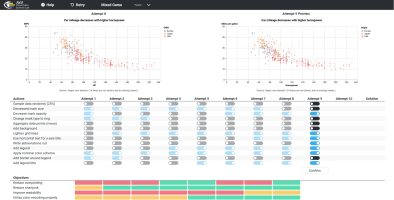
Iguanodon: A Code-Breaking Game for Improving Visualization Construction Literacy
IEEE Transactions on Visualization and Computer Graphics, 2025
The Changing Nature of Human-AI Relations: A Scoping Review on Terminology and Evolvement in the Scientific Literature
International Journal of Human–Computer Interaction, 2025
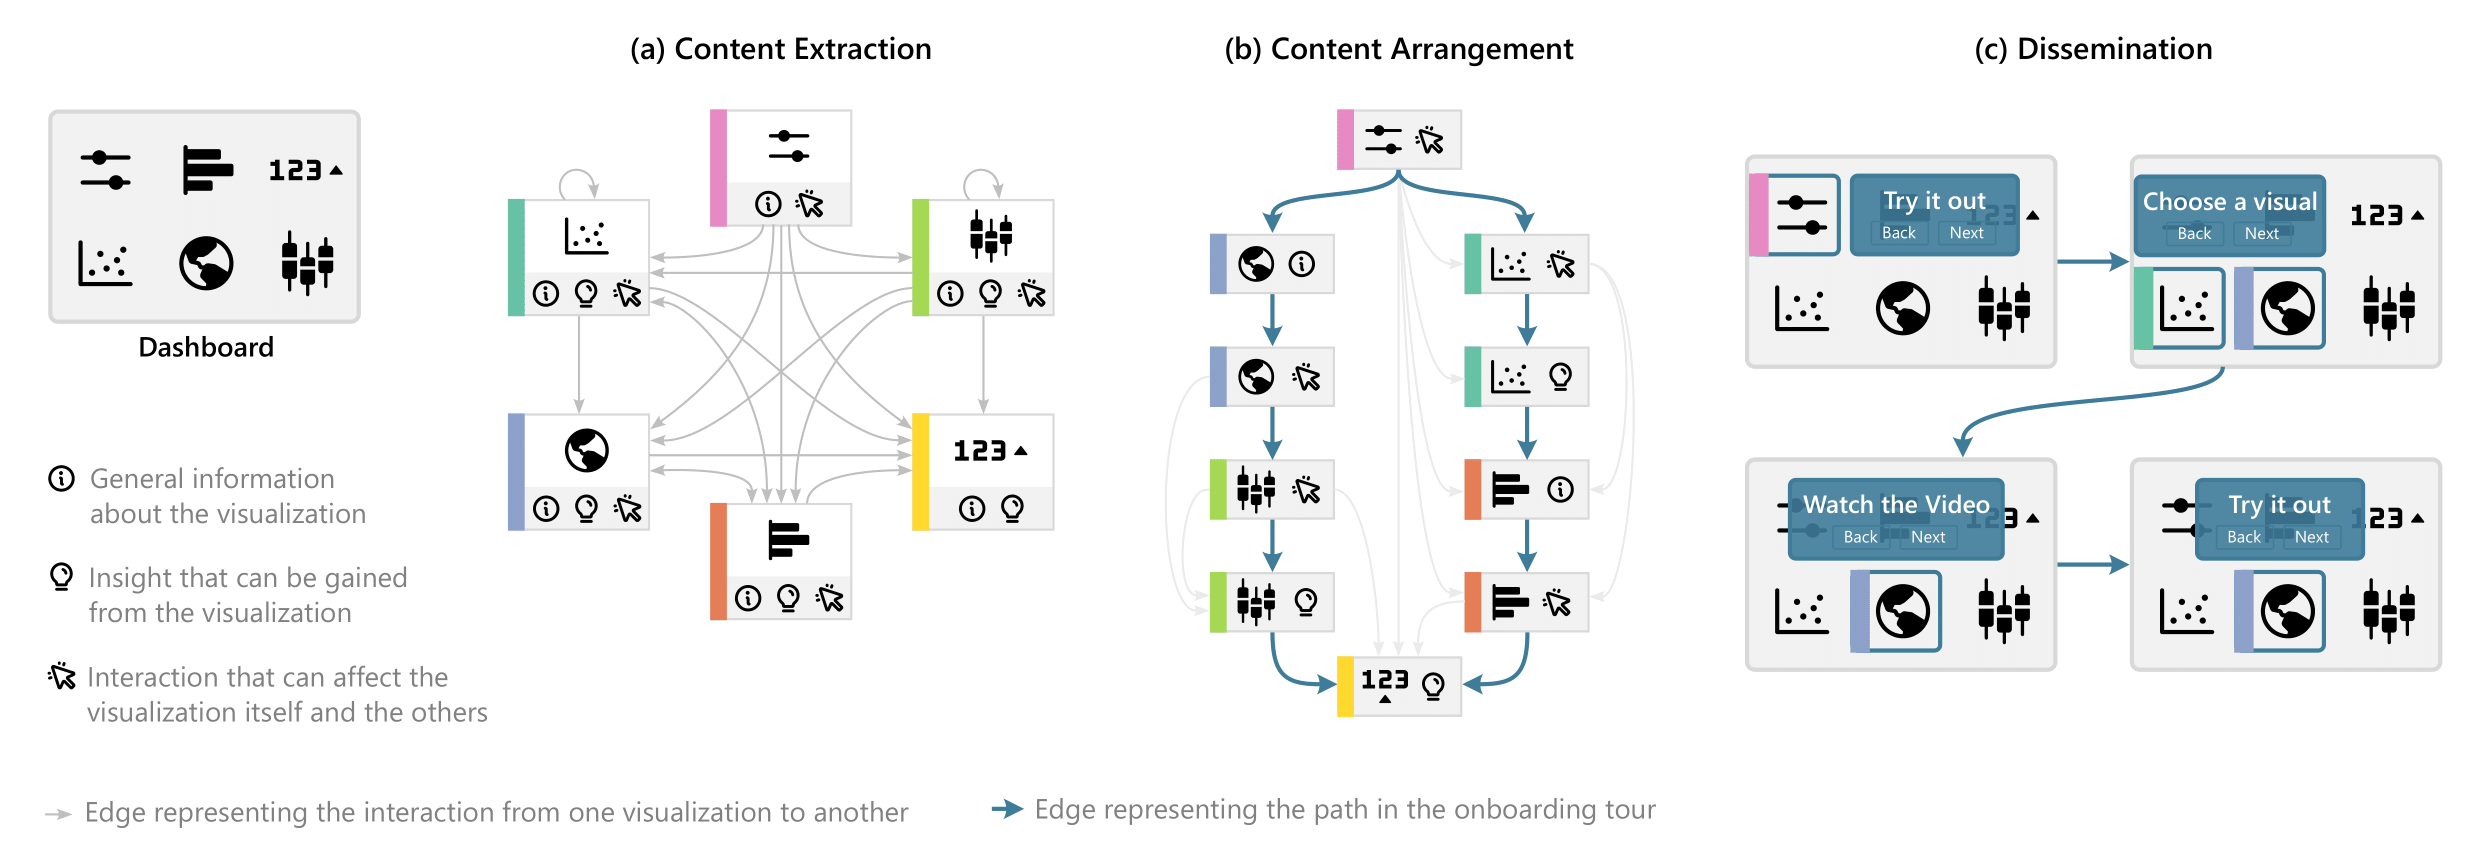
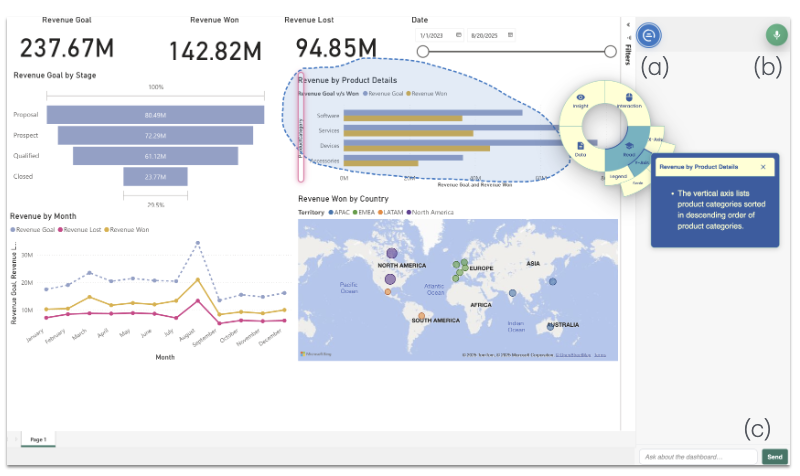
D-Tour: Semi-Automatic Generation of Interactive Guided Tours forVisualization Dashboard Onboarding
IEEE Transactions on Visualization and Computer Graphics, 2025

Personalized Complementarity in Human-AI Collaboration
Mensch und Computer 2024, International Workshop on Personalization and Recommendation, 2024
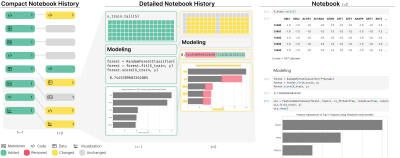
Loops: Leveraging Provenance and Visualization to Support Exploratory Data Analysis in Notebooks
IEEE Transactions on Visualization and Computer Graphics, 2024
Reassuring, Misleading, Debunking: Comparing Effects of XAI Methods on Human Decisions
ACM Transactions on Interactive Intelligent Systems, 2024
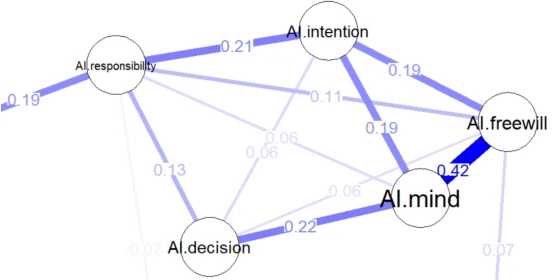
Moral reasoning in a digital age: Blaming artificial intelligence for incorrect high-risk decisions
Current Psychology, 2024
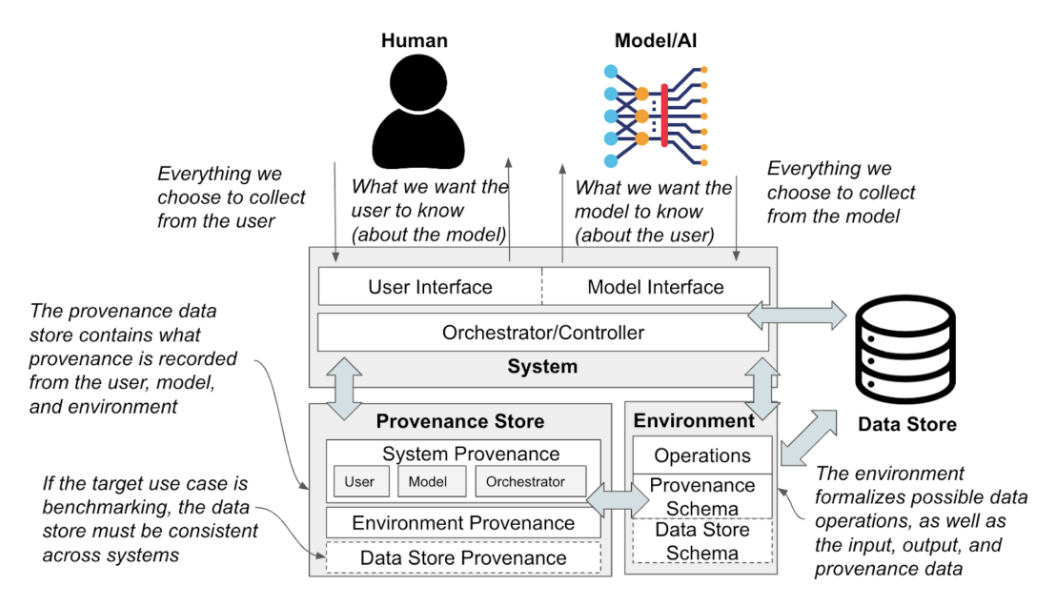
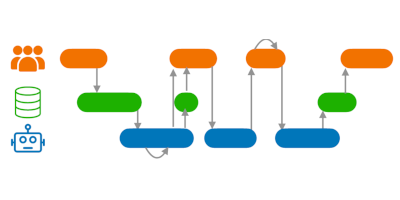
Human-Centered Approaches for Provenance in Automated Data Science (Dagstuhl Seminar 23372)
Dagstuhl Reports, 2024
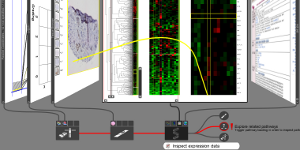
CIME4R: Exploring iterative, AI-guided chemical reaction optimization campaigns in their parameter space
Journal of Cheminformatics, 2024
Of Deadly Skullcaps and Amethyst Deceivers: Reflections on a Transdisciplinary Study on XAI and Trust
Workshop on Visualization for AI Explainability, 2023
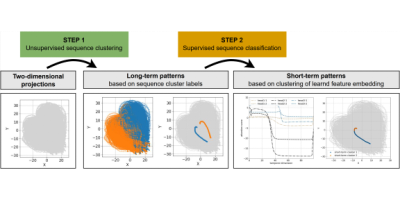
Explainable Long- and Short-term Pattern Detection in Projected Sequential Data
ECML PKDD Workshop on Explainable AI for Time Series: Advances and Applications (XAI-TS '23), 2023
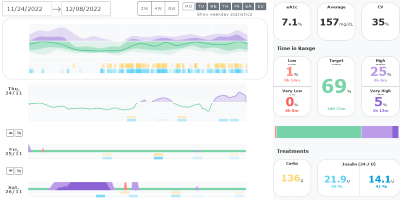
Marjorie: Visualizing Type 1 Diabetes Data to Support Pattern Exploration
IEEE Transactions on Visualization and Computer Graphics, 2024
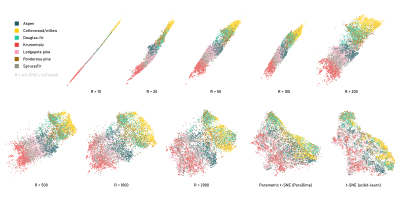
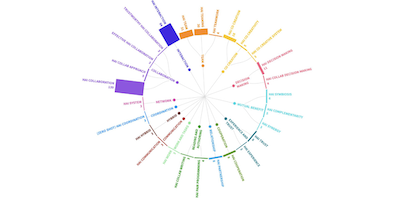
ParaDime: A Framework for Parametric Dimensionality Reduction
Computer Graphics Forum (EuroVis '23), 2023
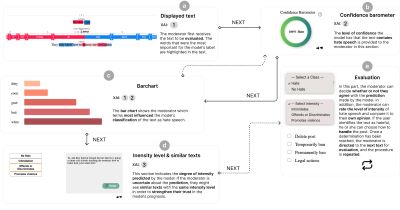
Exploring Intensities of Hate Speech on Social Media: A Case Study on Explaining Multilingual Models with XAI
Proceedings of the 4th Conference on Language, Data and Knowledge, 2023
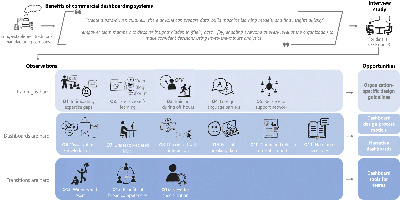
Transitioning to a Commercial Dashboarding System: Socio-technical Observations and Opportunities
IEEE Transactions on Visualization and Computer Graphics, 2024
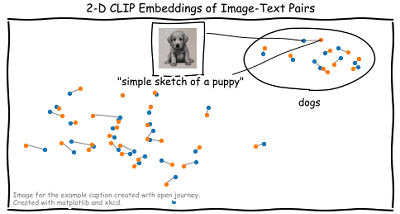
Understanding and Comparing Multi-Modal Models: Exploring the Latent Space of CLIP-like Models (CLIP, CyCLIP, CLOOB) Using Inter-Modal Pairs
6th Workshop on Visualization for AI Explainability, 2023
Best Submission Award at VISxAI 2023
Comparative Evaluations of Visualization Onboarding Methods
Visual Informatics, 2022
Effects of Explainable Artificial Intelligence on trust and human behavior in a high-risk decision task
Computers in Human Behavior, 2023
Towards a Human-Centered Approach for Automating Data Science
Workshop on Human-Centered AI at NeurIPS, 2022
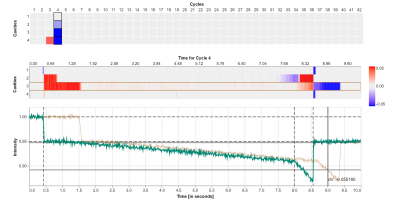
Visualizing and Monitoring the Process of Injection Molding
Electronic Imaging, 2023
Selected for Conference Highlights Session
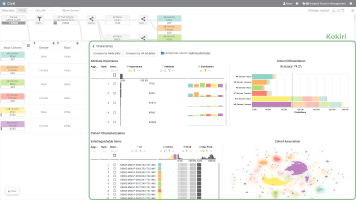
Kokiri: Random-Forest-Based Comparison and Characterization of Cohorts
IEEE VIS Workshop on Visualization in Biomedical AI, 2022
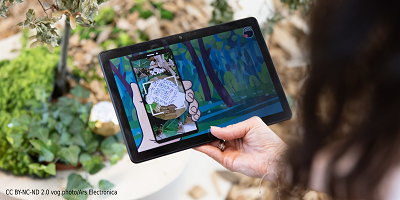
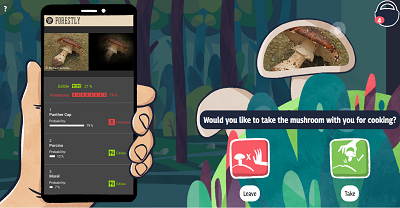
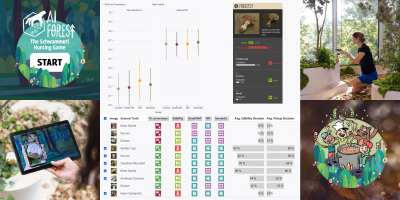
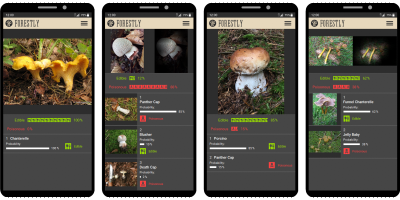
Explainable Artificial Intelligence improves human decision-making: Results from a mushroom picking experiment at a public art festival
International Journal of Human–Computer Interaction, 2023
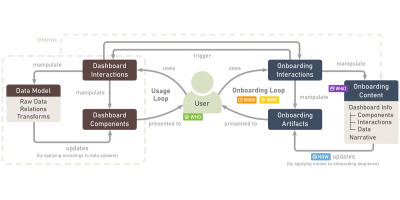
A Process Model for Dashboard Onboarding
Computer Graphics Forum (EuroVis '22), 2022
Visual Exploration of Relationships and Structure in Low-Dimensional Embeddings
IEEE Transactions on Visualization and Computer Graphics, 2023
Perspectives of Visualization Onboarding and Guidance in VA
Visual Informatics, 2022
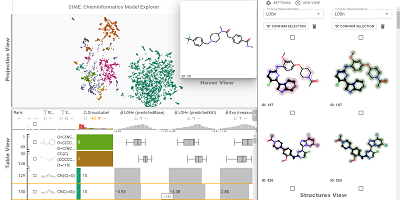
ChemInformatics Model Explorer (CIME): Exploratory Analysis of Chemical Model Explanations
Journal of Cheminformatics, 2022
Design and Comparative Evaluation of Visualization Onboarding Methods
Proceedings of the Symposium on Visual Information Communication and Interaction (VINCI ’21), 2021
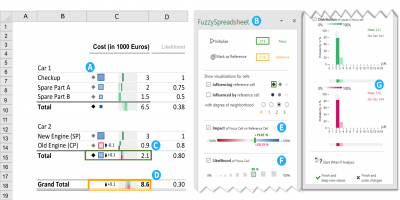
Fuzzy Spreadsheet: Understanding and Exploring Uncertainties in Tabular Calculations
IEEE Transactions on Visualization and Computer Graphics, 2023
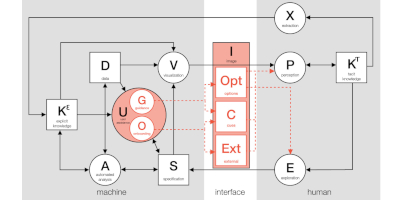
Operationalizing Human-Centered Perspectives in Explainable AI
Extended Abstracts of the 2021 CHI Conference on Human Factors in Computing Systems (CHI EA '21), 2021
A Forecasting Model-Based Discovery of Causal Links of Key Influencing Performance Quality Indicators for Sinter Production Improvement
Iron & Steel Technology, 2021
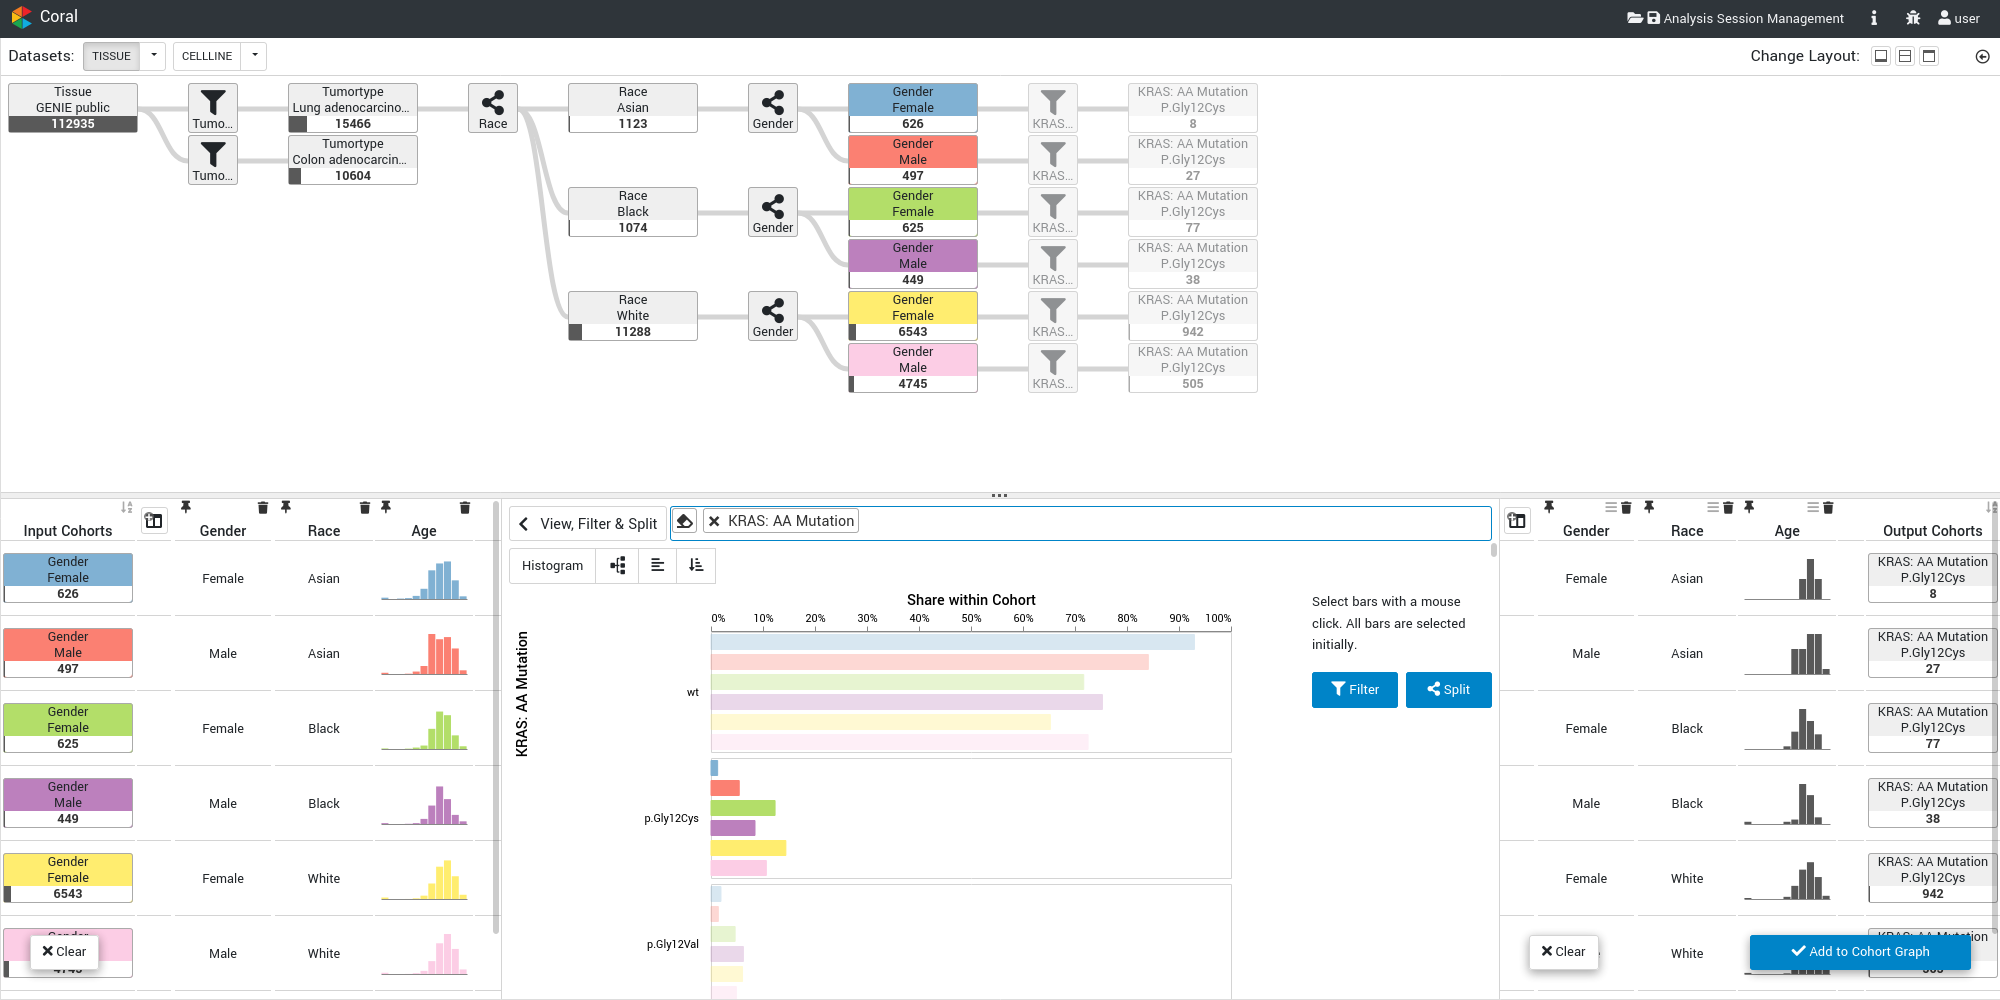
Coral: a web-based visual analysis tool for creating and characterizing cohorts
Bioinformatics, 2021
InstanceFlow: Visualizing the Evolution of Classifier Confusion at the Instance Level
2020 IEEE Visualization Conference – Short Papers, 2020
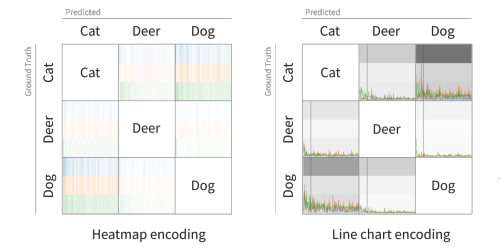
ConfusionFlow: A Model-Agnostic Visualization for Temporal Analysis of Classifier Confusion
IEEE Transactions on Visualization and Computer Graphics, 2022
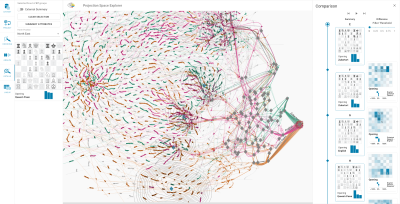
Projection Path Explorer: Exploring Visual Patterns in Projected Decision-Making Paths
ACM Transactions on Interactive Intelligent Systems, 2021
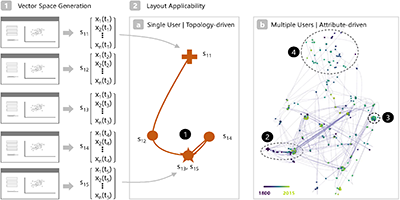
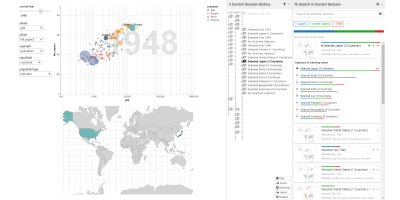
Provectories: Embedding-based Analysis of Interaction Provenance Data
IEEE Transactions on Visualization and Computer Graphics (Early Access), 2021
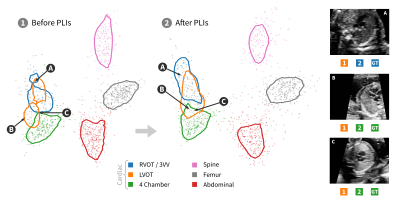
Projective Latent Interventions for Understanding and Fine-tuning Classifiers
Interpretable and Annotation-Efficient Learning for Medical Image Computing. Proceedings of the 3rd Workshop on Interpretability of Machine Intelligence in Medical Image Computing (iMIMIC 2020), 2020
Best Paper Award at iMIMIC 2020
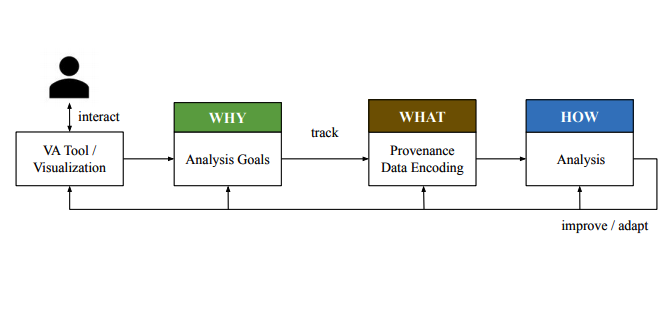
Survey on the Analysis of User Interactions and Visualization Provenance
Computer Graphics Forum, 2020
Guide Me in Analysis: A Framework for Guidance Designers
Computer Graphics Forum, 2020
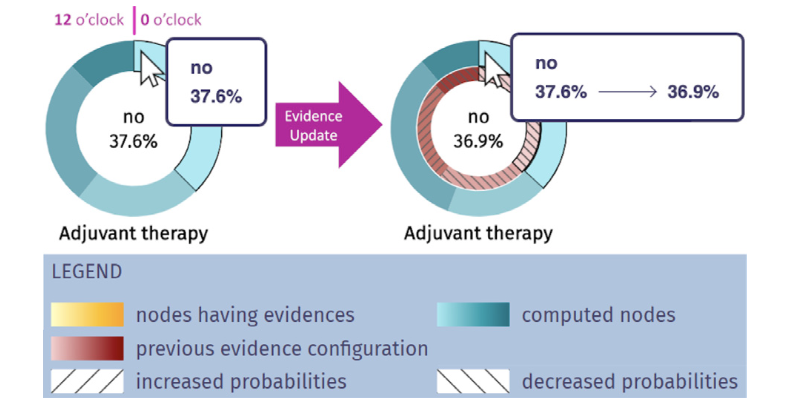
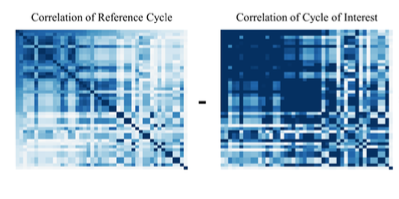
A Visual Approach to Explainable Computerized Clinical Decision Support
Computer & Graphics, Special Section on VCBM 2019, 2020
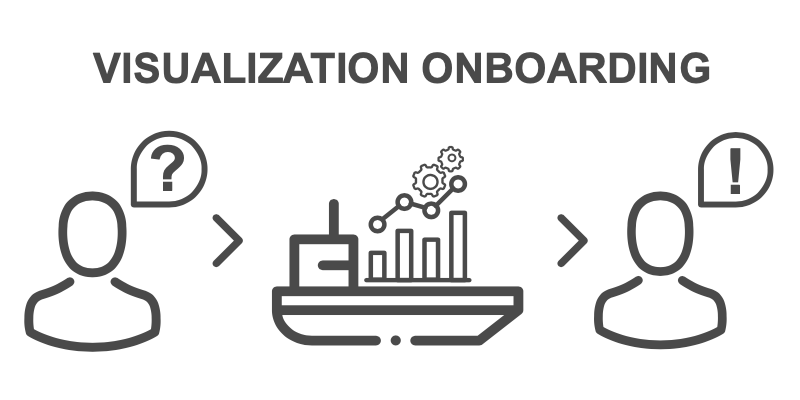
Visualization Onboarding: Learning How to Read and Use Visualizations
VisComm Workshop at IEEE VIS 2019, 2019
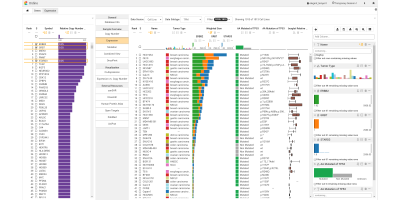
Taggle: Combining Overview and Details in Tabular Data Visualizations
Information Visualization, 2019
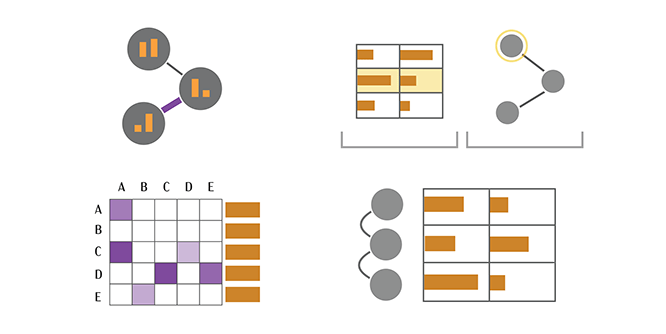
The State of the Art in Visualizing Multivariate Networks
Computer Graphics Forum (EuroVis '19), 2019
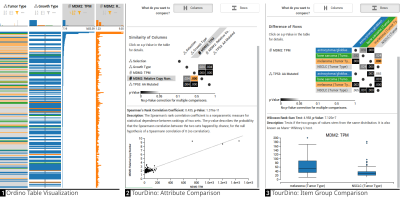
TourDino: A Support View for Confirming Patterns in Tabular Data
EuroVis Workshop on Visual Analytics (EuroVA '19), 2019
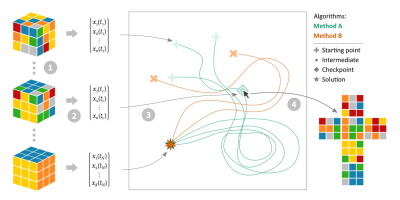
Visualization of Rubik's Cube Solution Algorithms
EuroVis Workshop on Visual Analytics (EuroVA '19), 2019
Ordino: visual analysis tool for ranking and exploring genes, cell lines, and tissue samples
Bioinformatics, 2019
KnowledgePearls: Provenance-Based Visualization Retrieval
IEEE Transactions on Visualization and Computer Graphics (VAST '18), 2018
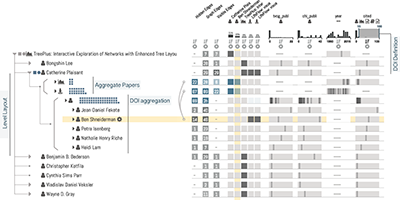
Juniper: A Tree+Table Approach to Multivariate Graph Visualization
IEEE Transactions on Visualization and Computer Graphics (InfoVis '18), 2018
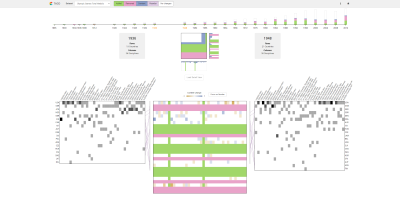
TACO: Visualizing Changes in Tables Over Time
IEEE Transactions on Visualization and Computer Graphics (InfoVis '17), 2018

Characterizing Guidance in Visual Analytics
IEEE Transactions on Visualization and Computer Graphics (VAST '16), 2017
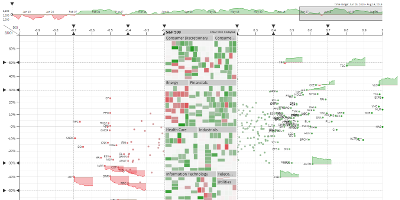
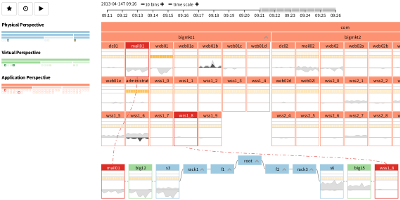
ThermalPlot: Visualizing Multi-Attribute Time-Series Data Using a Thermal Metaphor
IEEE Transactions on Visualization and Computer Graphics, 2016
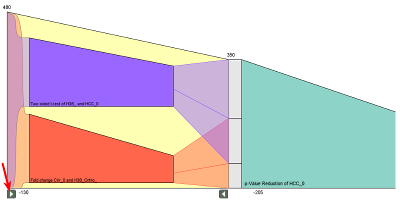
WeightLifter: Visual Weight Space Exploration for Multi-Criteria Decision Making
IEEE Transactions on Visualization and Computer Graphics (InfoVis '16), 2016
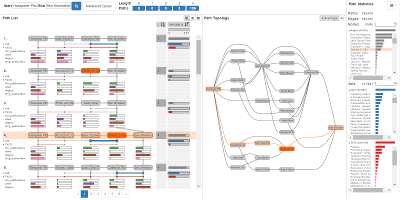
Pathfinder: Visual Analysis of Paths in Graphs
Computer Graphics Forum (EuroVis '16), 2016
EuroVis 2016 Honorable Mention Award
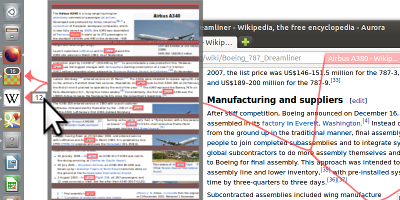
From Visual Exploration to Storytelling and Back Again
Computer Graphics Forum (EuroVis '16), 2016
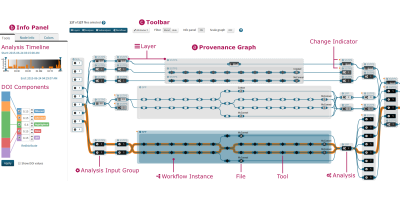
AVOCADO: Visualization of Workflow-Derived Data Provenance for Reproducible Biomedical Research
Computer Graphics Forum (EuroVis '16), 2016
CloudGazer: A Divide-and-Conquer Approach to Monitoring and Optimizing Cloud-Based Networks
Proceedings of IEEE Pacific Visualization Symposium (PacificVis '15), 2015
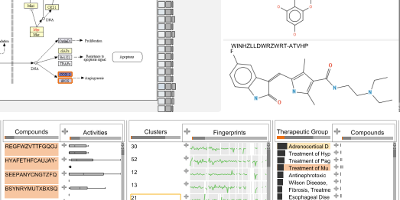
ConTour: Data-Driven Exploration of Multi-Relational Datasets for Drug Discovery
IEEE Transactions on Visualization and Computer Graphics (VAST '14), 2014
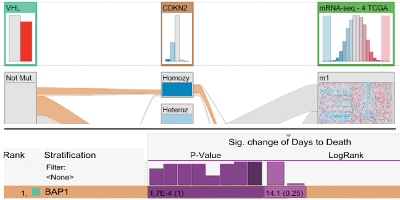
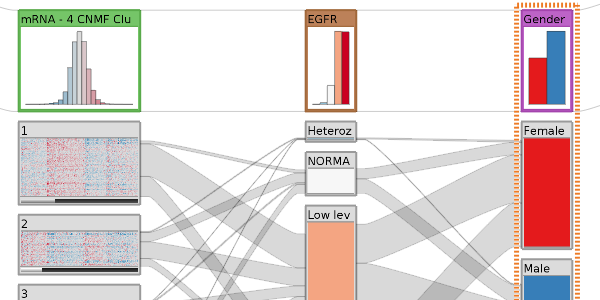
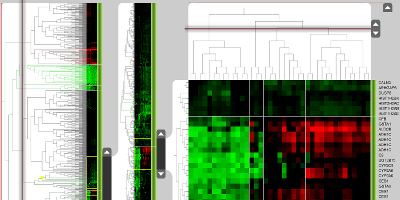
Guided Visual Exploration of Genomic Stratifications in Cancer
Nature Methods, 2014
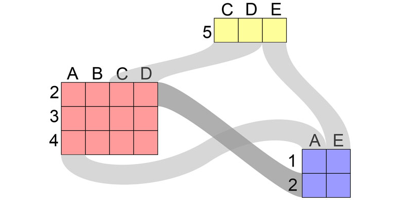
Domino: Extracting, Comparing, and Manipulating Subsets across Multiple Tabular Datasets
IEEE Transactions on Visualization and Computer Graphics (InfoVis '14), 2014
IEEE InfoVis 2014 Honorable Mention Award
Characterizing Cancer Subtypes using the Dual Analysis Approach in Caleydo StratomeX
IEEE Computer Graphics and Applications, 2014
Furby: Fuzzy Force-Directed Bicluster Visualization
BMC Bioinformatics, 15(Suppl 6), p. S4, 2014
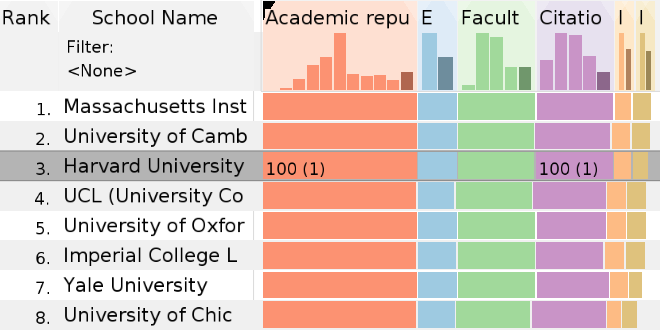
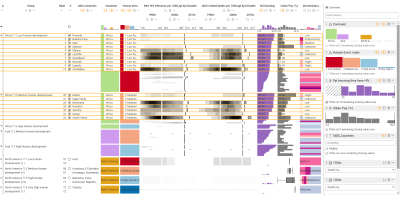
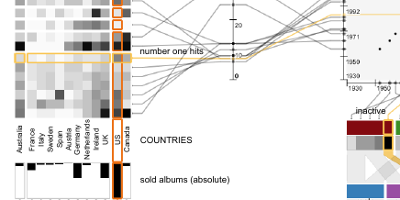
LineUp: Visual Analysis of Multi-Attribute Rankings
IEEE Transactions on Visualization and Computer Graphics (InfoVis '13), 2013
IEEE InfoVis 2013 Best Paper Award
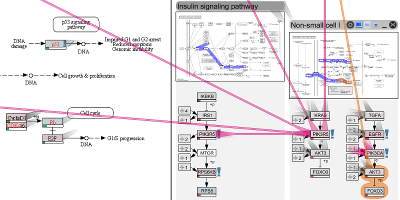
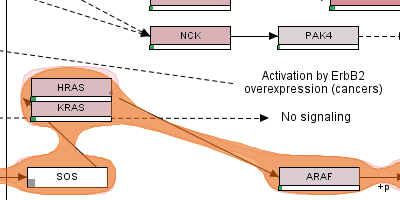
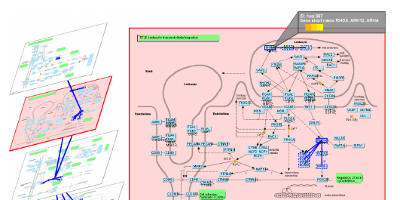
Entourage: Visualizing Relationships between Biological Pathways using Contextual Subsets
IEEE Transactions on Visualization and Computer Graphics (InfoVis '13), 2013
enRoute: Dynamic Path Extraction from Biological Pathway Maps for Exploring Heterogeneous Experimental Datasets
BMC Bioinformatics, 2013
Visualizing Uncertainty in Biological Expression Data
Proceedings of the SPIE Conference on Visualization and Data Analysis (VDA '12), 2012
Model-Driven Design for the Visual Analysis of Heterogeneous Data
IEEE Transactions on Visualization and Computer Graphics, 2012
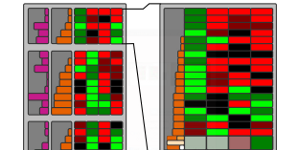
StratomeX: Visual Analysis of Large-Scale Heterogeneous Genomics Data for Cancer Subtype Characterization
Computer Graphics Forum (EuroVis '12), 2012
EuroVis 2012 3rd Best Paper Award
enRoute: Dynamic Path Extraction from Biological Pathway Maps for In-Depth Experimental Data Analysis
Proceedings of the IEEE Symposium on Biological Data Visualization (BioVis '12), 2012
IEEE BioVis 2012 Best Paper Award
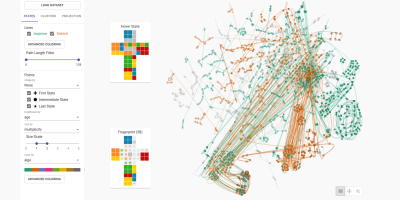
Visualizing the Effects of Logically Combined Filters
Proceedings of the Conference on Information Visualisation (IV '11), 2011
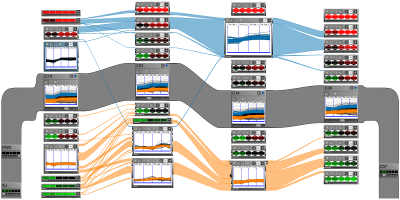
VisBricks: Multiform Visualization of Large, Inhomogeneous Data
IEEE Transactions on Visualization and Computer Graphics (InfoVis '11), 2011
Caleydo: Design and Evaluation of a Visual Analysis Framework for Gene Expression Data in its Biological Context
Proceedings of IEEE Pacific Visualization Symposium (PacificVis '10), 2010
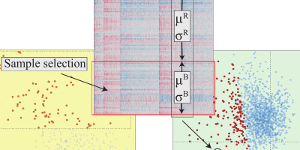
Comparative Analysis of Multidimensional, Quantitative Data
IEEE Transactions on Visualization and Computer Graphics (InfoVis '10), 2010
Connecting Genes with Diseases
Proceedings of the Conference on Information Visualisation (IV '09), 2009
Gaze-Based Focus Adaption in an Information Visualization System
Proceedings of the Conference on Computer Graphics and Visualization and Image Processing (CGVCVIP '09), 2009
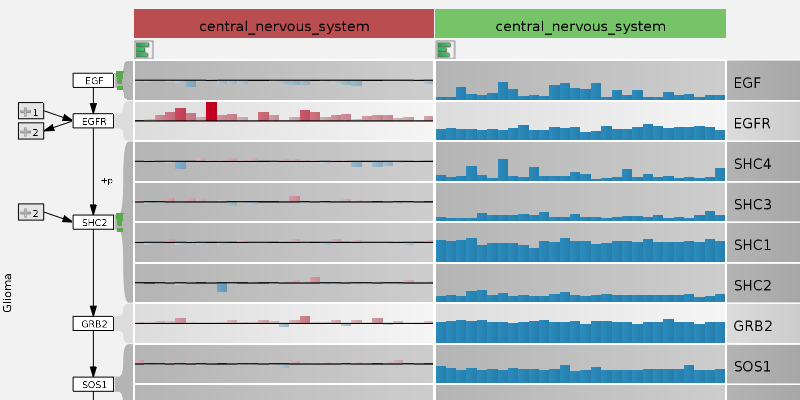
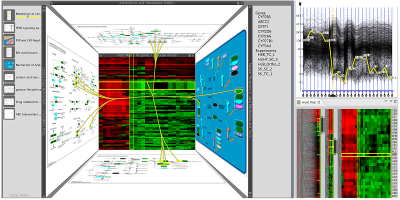
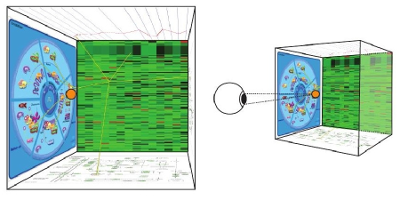
Caleydo: Connecting Pathways with Gene Expression
Bioinformatics, 2009
Navigation and Exploration of Interconnected Pathways
Computer Graphics Forum (EuroVis '08), 2008
Book Chapters

Editors:
Visualization Psychology
Chapter: Visualization Onboarding Grounded in Educational Theories
Springer, 2023.

Editors:
Foundations of Data Visualization
Chapter: Collaborating Successfully with Domain Experts
Springer, 2020.
Editors:
Foundations of Data Visualization
Chapter: Case Studies for Working with Domain Experts
Springer, 2020.
Commentaries

Points of View: Temporal data
Nature Methods 12, 97, 2015.

Points of View: Bar Charts and Box Plots
Nature Methods 11, 117, 2014.
Editorials
Highlights from the 5th Symposium on Biological Data Visualization: Part 2
BMC Proceedings, 9(Suppl 6):S1, 2015.
Highlights from the 5th Symposium on Biological Data Visualization: Part 1
BMC Bioinformatics, 16(Suppl 11):S1, 2015.

Special Issue on Visual Analytics
IEEE Computer, 46, 7, 2013.
Theses
Andreas Hinterreiter
Visual Explanations of High-dimensional and Temporal Processes
Johannes Kepler University Linz, PhD Thesis, 2022
Holger Stitz
Interactive Focus+Context Analysis of Time-Series and Provenance Data
Johannes Kepler University Linz, PhD Thesis, 2019
Samuel Gratzl
Visually Guiding Users in Selection, Exploration, and Presentation Tasks
Johannes Kepler University Linz, PhD Thesis, 2017
Selected Abstracts and Posters
How Far Can Public Transport Take You?
Abstract
Poster
IEEE VIS Workshop on Visualising Cities (CityVis '23), Melbourne, AU, 2023.
Visualizing Pairwise Feature Interactions in Neural Additive Models
Abstract
Poster
EG Conference on Visualization (EuroVis '23), Leipzig, DE, 2023.
Interactive Attribution-based Explanations for Image Segmentation
Abstract
Poster
Video
EG Conference on Visualization (EuroVis '22), Rome, IT, 2022.
ConfusionFlow: Visualizing Neural Network Confusion Across Epochs
Abstract
Video
IEEE Conference on Visual Analytics Science and Technology (VAST '18), Berlin, Germany, 2018.
Provenance-Based Visualization Retrieval
Abstract
Poster
Video
IEEE Conference on Visual Analytics Science and Technology (VAST '17), Phoenix, AZ, USA, 2017.
IEEE VAST 2017 Best Poster Award
Taggle: Scaling Table Visualization through Aggregation
Abstract
Poster
Video
IEEE Conference on Information Visualization (InfoVis '17), Phoenix, AZ, USA, 2017.
TaCo: Comparative Visualization of Large Tabular Data
Abstract
Poster
Video
Poster Compendium of the Eurographics/IEEE Symposium on Visualization (EuroVis '16), Groningen, Netherlands, 2016.
Visual Evaluation of Cloud Infrastructure Performance Predictions
Abstract
Poster
IEEE Conference on Information Visualization (InfoVis '16), Baltimore, MD, USA, 2016.
Interactive Visualization of Provenance Graphs for Reproducible Biomedical Research
Abstract
Poster
IEEE Conference on Information Visualization (InfoVis '15), Chicago, IL, USA, 2015.
IEEE InfoVis 2015 Best Poster Award
ThermalPlot: Visualizing Multi-Attribute Time-Series Data Using a Thermal Metaphor
Abstract
Poster
IEEE Conference on Information Visualization (InfoVis '15), Chicago, IL, USA, 2015.
IEEE InfoVis 2015 Honorable Mention Poster Award
Caleydo Web: An Integrated Visual Analysis Platform for Biomedical Data
Abstract
Poster
IEEE Conference on Information Visualization (InfoVis '15), Chicago, IL, USA, 2015.
Transparent Layering for Visualizing Dynamic Graphs Using the Flip Book Metaphor
Abstract
Poster
IEEE Conference on Information Visualization (InfoVis '14), Paris, France, 2014.
ConTour: Data-Driven Exploration of Multi-Relational Datasets for Drug Discovery
Poster
Symposium on Biological Data Visualization (BioVis '14), ISMB, Boston, MA, USA, 2014.
Refinery Platform: A Foundation for Integrative Data Visualization Tools
Poster
Symposium on Biological Data Visualization (BioVis '14), ISMB, Boston, MA, USA, 2014.
Towards a Characterization of Guidance in Visualization
Abstract
Poster
IEEE Conference on Information Visualization (InfoVis '13), Atlanta, GA, USA, 2013.
StratomeX: Guided Visual Exploration for Tumor Subtype Identification in The Cancer Genome Atlas
Abstract
The Cancer Genome Atlas' 2nd Annual Scientific Symposium, Crystal City, VA, USA, 2012.
StratomeX: Enabling Visualization-Driven Cancer Subtype Analysis
Abstract
Poster
IEEE Symposium on Biological Data Visualization (BioVis '12), Seattle, WA, USA, 2012.
Guided Visual Analysis for the Identification of Cancer Subtypes
Abstract
The Cancer Genome Atlas’ Semi-Annual Steering Committee Meeting, Houston, TX, US, 2012.
StratomeX - Integrative Visualization of Tumor Subtypes in Cancer Genomics Data Sets
Abstract
EMBO Workshop on Visualizing Biological Data (VIZBI '12), Heidelberg, Germany, 2012.
Does Software Engineering Pay Off for Research? Lessons Learned from the Caleydo Project
Abstract
Eurographics Workshop on Visual Computing for Biomedicine (VCBM '10), Leipzig, Germany, 2010.
Gene- and Protein Expression Profiling in Liver in a Sepsis-Baboon Model
Conference on SHOCK, 31, 4-4, San Antonio, Texas, USA, 2009.
CALEYDO
Poster
ZMF.Day (Center for Medical Research), Graz, Austria, 2008.
Multiple View Visualization On A Multi Display Setup
Poster
International Workshop on Giga-Pixel Displays & Visual Analytics (GIANT '08), Leeds, UK, 2008.
Interactive Visualization of Metabolic Pathways
Poster
IEEE Conference on Visualization (Vis '07), Sacramento, CA, USA, 2007.