Abstract
Answering questions about complex issues often requires analysts to take into account information contained in multiple interconnected datasets. A common strategy in analyzing and visualizing large and heterogeneous data is dividing it into meaningful subsets. Interesting subsets can then be selected and the associated data and the relationships between the subsets visualized. However, neither the extraction and manipulation nor the comparison of subsets is well supported by state-of-the-art techniques.
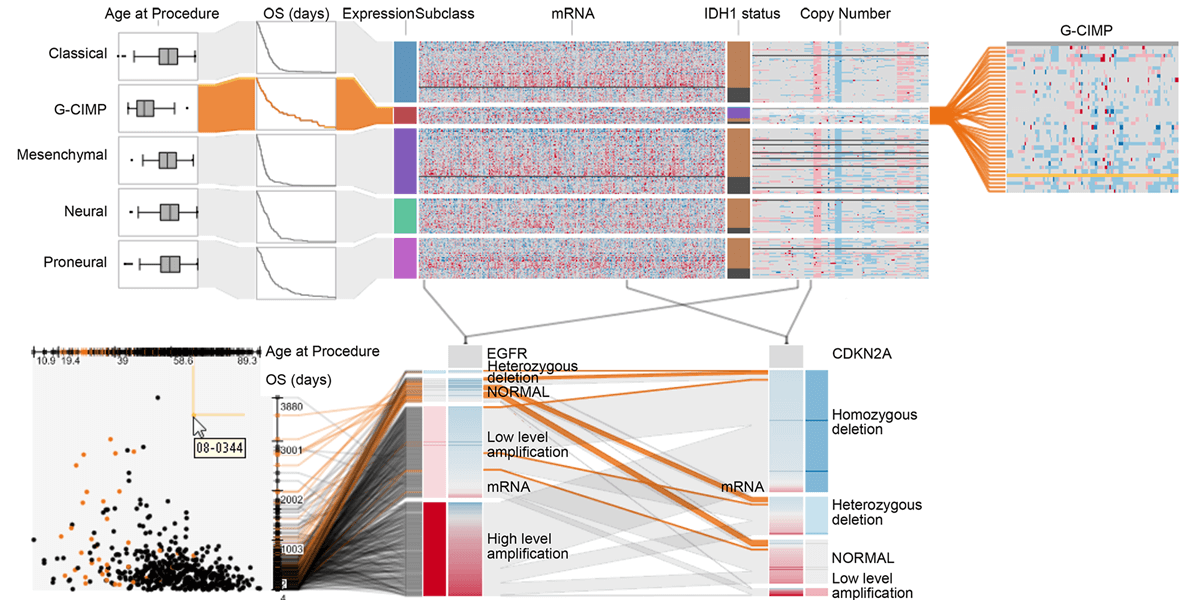
In this paper we present Domino, a novel multiform visualization technique for effectively representing subsets and the relationships between them. By providing comprehensive tools to arrange, combine, and extract subsets, Domino allows users to create both common visualization techniques and advanced visualizations tailored to specific use cases. In addition to the novel technique, we present an implementation that enables analysts to manage the wide range of options that our approach offers. Innovative interactive features such as placeholders and live previews support rapid creation of complex analysis setups. We introduce the technique and the implementation using a simple example and demonstrate scalability and effectiveness in a use case from the field of cancer genomics.
Citation
Samuel
Gratzl,
Nils Gehlenborg,
Alexander Lex,
Hanspeter Pfister,
Marc
Streit
Domino: Extracting, Comparing, and Manipulating Subsets across Multiple Tabular Datasets
IEEE Transactions on Visualization and Computer Graphics (InfoVis '14),
20(12):
2023--2032, doi:10.1109/TVCG.2014.2346260, 2014.
IEEE InfoVis 2014 Honorable Mention Award
BibTeX
@article{2014_infovis_domino,
    title = {Domino: Extracting, Comparing, and Manipulating Subsets across Multiple Tabular Datasets },
    author = {Samuel Gratzl and Nils Gehlenborg and Alexander Lex and Hanspeter Pfister and Marc Streit},
    journal = {IEEE Transactions on Visualization and Computer Graphics (InfoVis '14)},
    doi = {10.1109/TVCG.2014.2346260},
    volume = {20},
    number = {12},
    pages = {2023--2032},
    year = {2014}
}
Acknowledgements
This work was supported in part by the Austrian Research Promotion Agency (840232), the Austrian Science Fund (J 3437-N15), the Air Force Research Laboratory and DARPA grant FA8750-12-C-0300, and the United States NIH/National Human Genome Research Institute (K99 HG007583).