Abstract
Background: Cluster analysis is widely used to discover patterns in multi-dimensional data. Clustered heatmaps are the standard technique for visualizing one-way and two-way clustering results. In clustered heatmaps, rows and/or columns are reordered, resulting in a representation that shows the clusters as contiguous blocks. However, for biclustering results, where clusters can overlap, it is not possible to reorder the matrix in this way without duplicating rows and/or columns.
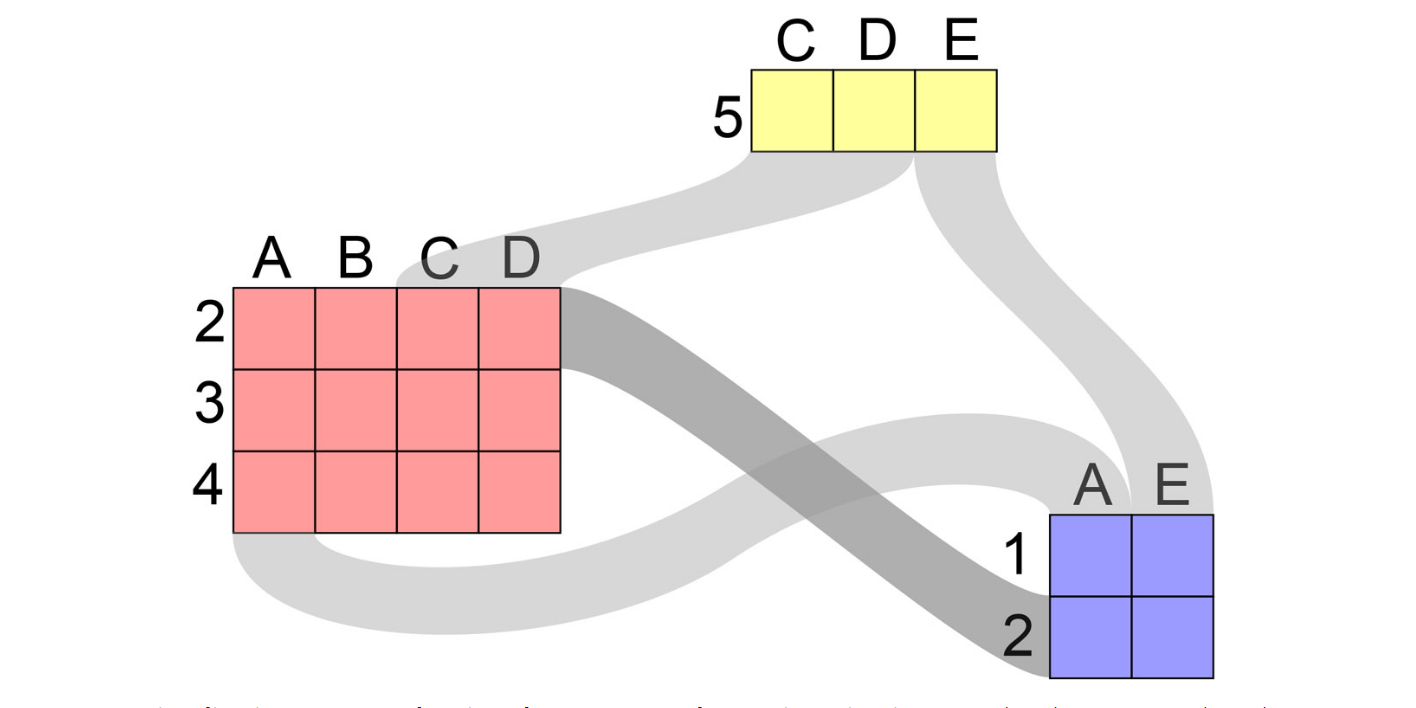
Results: We present Furby, an interactive visualization technique for analyzing biclustering results. Our contribution is twofold. First, the technique provides an overview of a biclustering result, showing the actual data that forms the individual clusters together with the information which rows and columns they share. Second, for fuzzy clustering results, the proposed technique additionally enables analysts to interactively set the thresholds that transform the fuzzy (soft) clustering into hard clusters that can then be investigated using heatmaps or bar charts. Changes in the membership value thresholds are immediately reflected in the visualization. We demonstrate the value of Furby by loading biclustering results applied to a multi-tissue dataset into the visualization.
Conclusions: The proposed tool allows analysts to assess the overall quality of a biclustering result. Based on this high-level overview, analysts can then interactively explore the individual biclusters in detail. This novel way of handling fuzzy clustering results also supports analysts in finding the optimal thresholds that lead to the best clusters.
Citation
Marc
Streit,
Samuel
Gratzl,
Michael Gillhofer,
Andreas Mayr,
Andreas Mitterecker,
Sepp Hochreiter
Furby: Fuzzy Force-Directed Bicluster Visualization
BMC Bioinformatics, 15(Suppl 6), p. S4,
15(Suppl 6):
S4, doi:10.1186/1471-2105-15-S6-S4, 2014.
BibTeX
@article{2014_bmc_furby,
    title = {Furby: Fuzzy Force-Directed Bicluster Visualization},
    author = {Marc Streit and Samuel Gratzl and Michael Gillhofer and Andreas Mayr and Andreas Mitterecker and Sepp Hochreiter},
    journal = {BMC Bioinformatics, 15(Suppl 6), p. S4},
    doi = {10.1186/1471-2105-15-S6-S4},
    volume = {15},
    number = {Suppl 6},
    pages = {S4},
    year = {2014}
}
Datasets
The following projects contain public demo data, which can be used to test Furby. But everyone is welcome to load his/her own data, via the Load BiCluster Results tab within the Caleydo Startup-Wizard.
- Caleydo-Project (CAL) containing Microarray data from Broad Institute “Cancer Program Data Sets” which was produced by Su et al. 2002. It consists of 102 samples and 5565 genes as was clustered using the FABIA algorithm.
- Zip package (ZIP) containing the exported CSV-files using to create the previous Caleydo-Project
Utilities
We provide two helper R-Scripts, which simplify exporting R bicluster results in the correct format.