Abstract
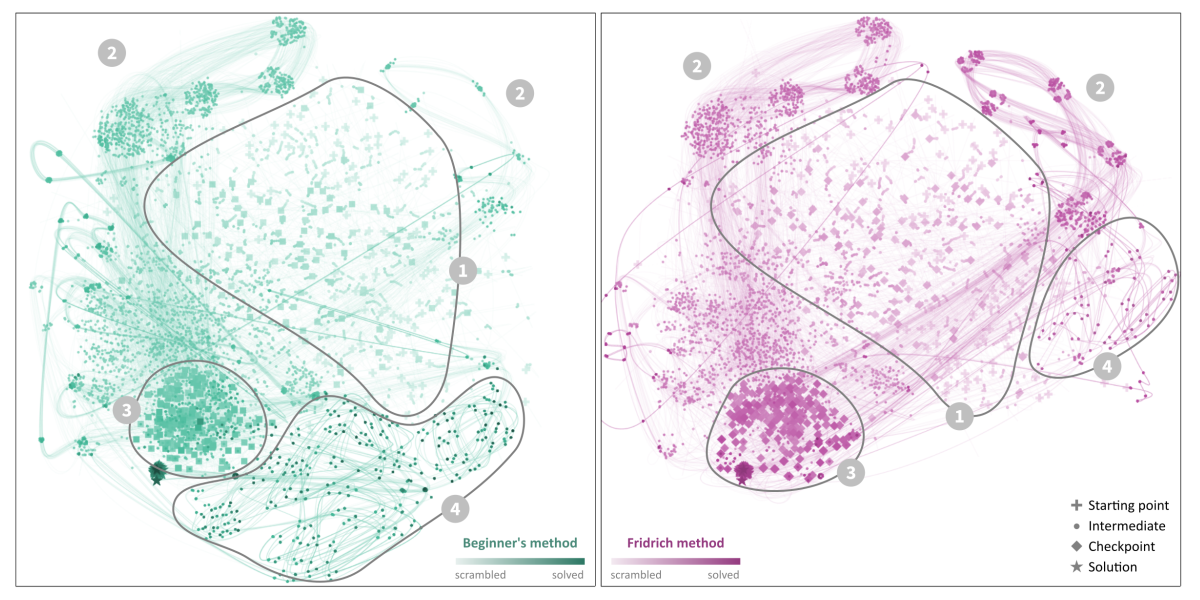
Rubik’s Cube is among the world’s most famous puzzle toys. Despite its relatively simple principle, it requires dedicated, carefully planned algorithms to be solved. In this paper, we present an approach to visualize how different solution algorithms navigate through the high-dimensional space of Rubik’s Cube states. We use t-distributed stochastic neighbor embedding (t-SNE) to project feature vector representations of cube states to two dimensions. t-SNE preserves the similarity of cube states and leads to clusters of intermediate states and bundles of cube solution pathways in the projection. Our prototype implementation allows interactive exploration of differences between algorithms, showing detailed state information on demand.
Citation
Christian A.
Steinparz,
Andreas
Hinterreiter,
Holger
Stitz,
Marc
Streit
Visualization of Rubik's Cube Solution Algorithms
EuroVis Workshop on Visual Analytics (EuroVA '19),
doi:10.2312/eurova.20191119, 2019.
BibTeX
@inproceedings{2019_eurova_rubik,
    title = {Visualization of Rubik's Cube Solution Algorithms},
    author = {Christian A. Steinparz and Andreas Hinterreiter and Holger Stitz and Marc Streit},
    booktitle = {EuroVis Workshop on Visual Analytics (EuroVA '19)},
    editor = {Landesberger, Tatiana von and Turkay, Cagatay},
    publisher = {The Eurographics Association},
    doi = {10.2312/eurova.20191119},
    year = {2019}
}
Acknowledgements
This work was supported in part by the State of UpperAustria (FFG 851460, Human-Interpretable Machine Learning) and the Austrian Science Fund (FWF P27975-NBL).