Abstract
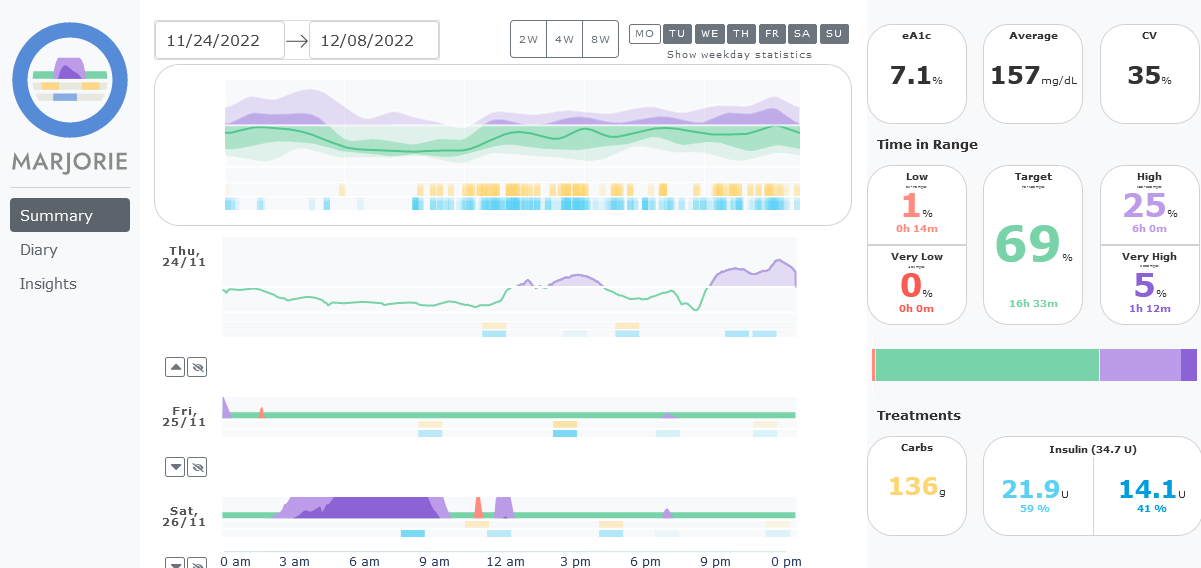
In this work we propose Marjorie, a visual analytics approach to address the challenge of analyzing patients' diabetes data during brief regular appointments with their diabetologists. Designed in consultation with diabetologists, Marjorie uses a combination of visual and algorithmic methods to support the exploration of patterns in the data. Patterns of interest include seasonal variations of the glucose profiles, and non-periodic patterns such as fluctuations around mealtimes or periods of hypoglycemia (i.e., glucose levels below the normal range). We introduce a unique representation of glucose data based on modified horizon graphs and hierarchical clustering of adjacent carbohydrate or insulin entries. Semantic zooming allows the exploration of patterns on different levels of temporal detail. We evaluated our solution in a case study, which demonstrated Marjorie's potential to provide valuable insights into therapy parameters and unfavorable eating habits, among others. The study results and informal feedback collected from target users suggest that Marjorie effectively supports patients and diabetologists in the joint exploration of patterns in diabetes data, potentially enabling more informed treatment decisions. A free copy of this paper and all supplemental materials are available at https://osf.io/34t8c.
Citation
Anna Scimone,
Klaus
Eckelt,
Marc
Streit,
Andreas
Hinterreiter
Marjorie: Visualizing Type 1 Diabetes Data to Support Pattern Exploration
IEEE Transactions on Visualization and Computer Graphics,
30(1):
1216-1226, doi:10.1109/TVCG.2023.3326936, 2024.
BibTeX
@article{2023_marjorie,
    title = {Marjorie: Visualizing Type 1 Diabetes Data to Support Pattern Exploration},
    author = {Anna Scimone and Klaus Eckelt and Marc Streit and Andreas Hinterreiter},
    journal = {IEEE Transactions on Visualization and Computer Graphics},
    doi = {10.1109/TVCG.2023.3326936},
    volume = {30},
    number = {1},
    pages = {1216-1226},
    month = {jan},
    year = {2024}
}