Visualizing large & heterogeneous experimental data with enRoute and pathway interdependencies with Entourage.
Pathways are graphs that model diverse biological processes on a molecular level. They depict the interaction of genes, proteins and other entities on a semantic level, as a small subset out of the overall biological network. These subsets are curated for their functional relevance and are mostly generic for an organism or a specific disease state. While this subsetting approach is necessary to deal with the complexity of the networks, there are many situations where a broader view is desirable, for example when investigating side-effects of drugs. Furthermore, it is necessary to understand the peculiarites of individual patients, samples, or cohorts with respect to a pathway, as pathways can be modulated, for example, through a disease. The integrated pathway visualization techniques in Caleydo aim to address these challenges. Entourage provides contextual information for a focus pathway by visualizing relevant subsets in other pathways. enRoute visualizes large and heterogeneous experimental datasets for pathways.
Entourage
Entourage is a visualization technique to efficiently perform multi-pathway analysis as it is often important to see relationships that are not included in the pathway. One of those situations is when an analyst would like to check for side-effects of a drug, to see if, for example, it could have a side effect in another process.
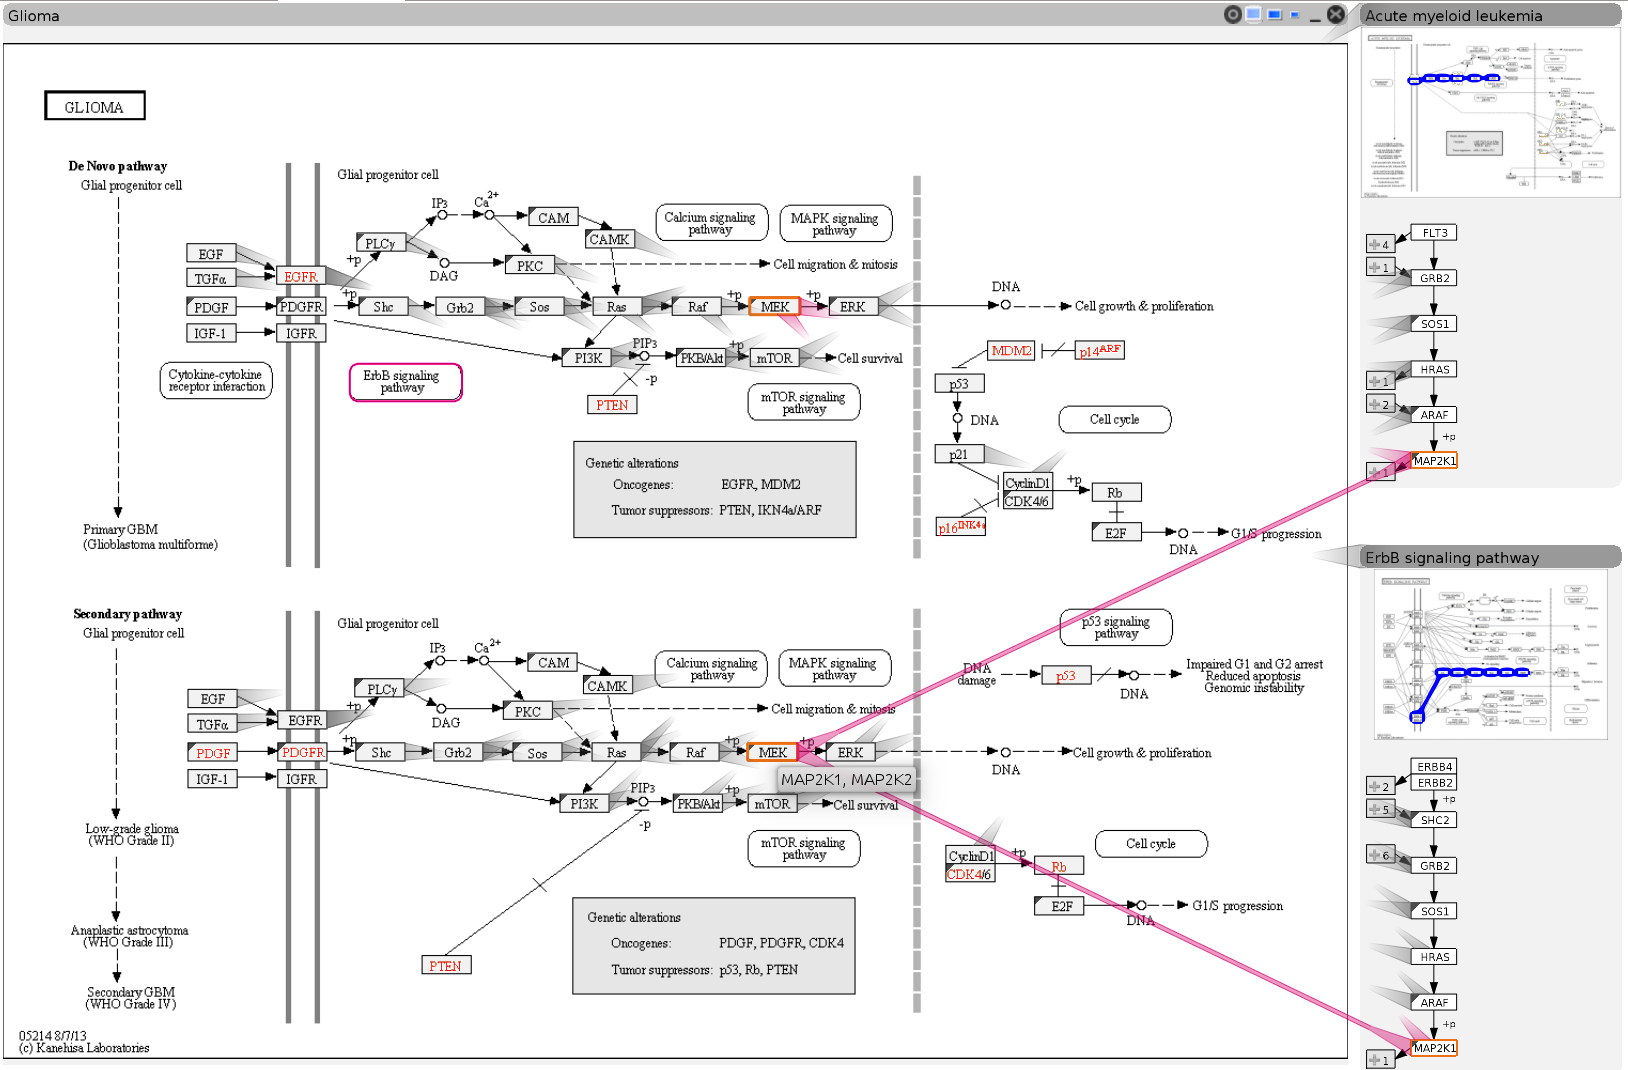
Entourage helps to find answers to this question by enabling analysts to analyze multiple pathways at the same time. To deal with the limited display space and the large number of nodes and edges, Entourage only shows one pathway focus pathway in full detail, while other pathways show contextually relevant information. What is contextually relevant is determined by a focus node selected by the analyst. All context pathways that share this node adapt their representations to only show the surroundings of this node as paths. Entourage also indicates all shared nodes between pathways by using the non-obstrusive, yet effective stubs of visual links, which are extended to full, traceable links that connect shared nodes on demand. The following figure shows the KEGG Glioma pathway in focus and contextual information derived from two other pathways. We can see that these three pathways share a similar path.
In addition to the visualization of relationships between selected pathways, Entourage allows analysts to dynamically define their focus and supports them in finding relevant and related pathways in the context of an analysis. Pathway exploration in Entourage can also be triggered out of the StratomeX view
enRoute
Entourage is integrated with enRoute, the visualization technique for experimental data in pathways. Biological pathways are an important source of information when investigating experimental data in the context of cellular processes. Visualizing large and heterogeneous amounts of experimental data on top of pathways is, however, challenging. Most commonly, average expression values are shown color-coded on top of a node, which allows to compare only very few experimental values at the same time and is perceptually inefficient.
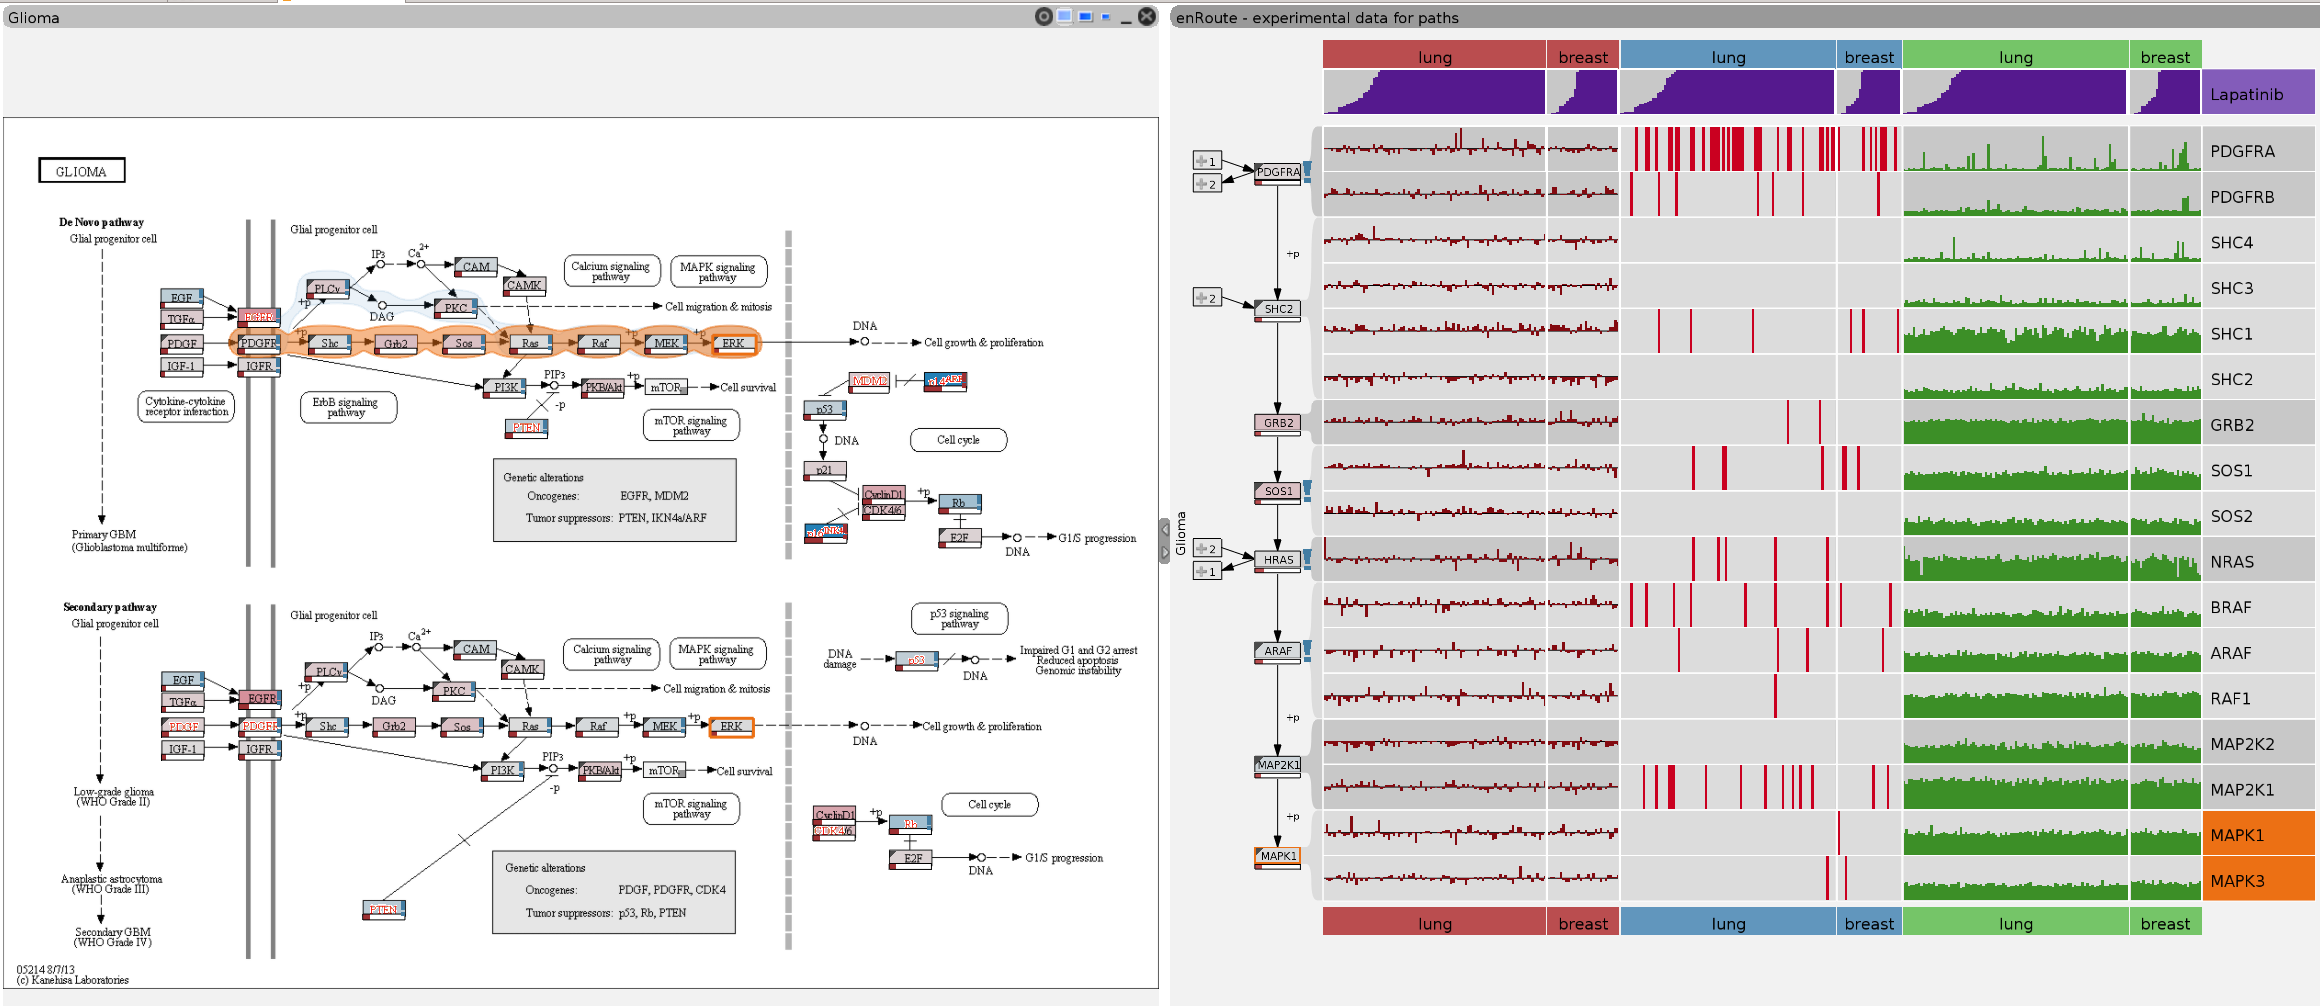
enRoute addresses this problem by enabling analysts to dynamically extract paths from pathways. For the extracted, linear paths enRoute shows rich and detailed visualizations of the experimental data. The following figure shows the selected path in the pathway, highlighted in orange, with the enRoute view on its right. The pathway nodes are color coded for copy number changes. The enRoute view shows copy number, mutation and expression data, as well as drug response data for 120 cell lines from two different tissues (lung and breast), using bar charts for numerical data and heat maps for categorical data. This representation of the extracted path allows analysts to reason about individual patients’ particular genetic profile along the path of interest and supports a very efficient comparrison between patients and patient groups.
Integration
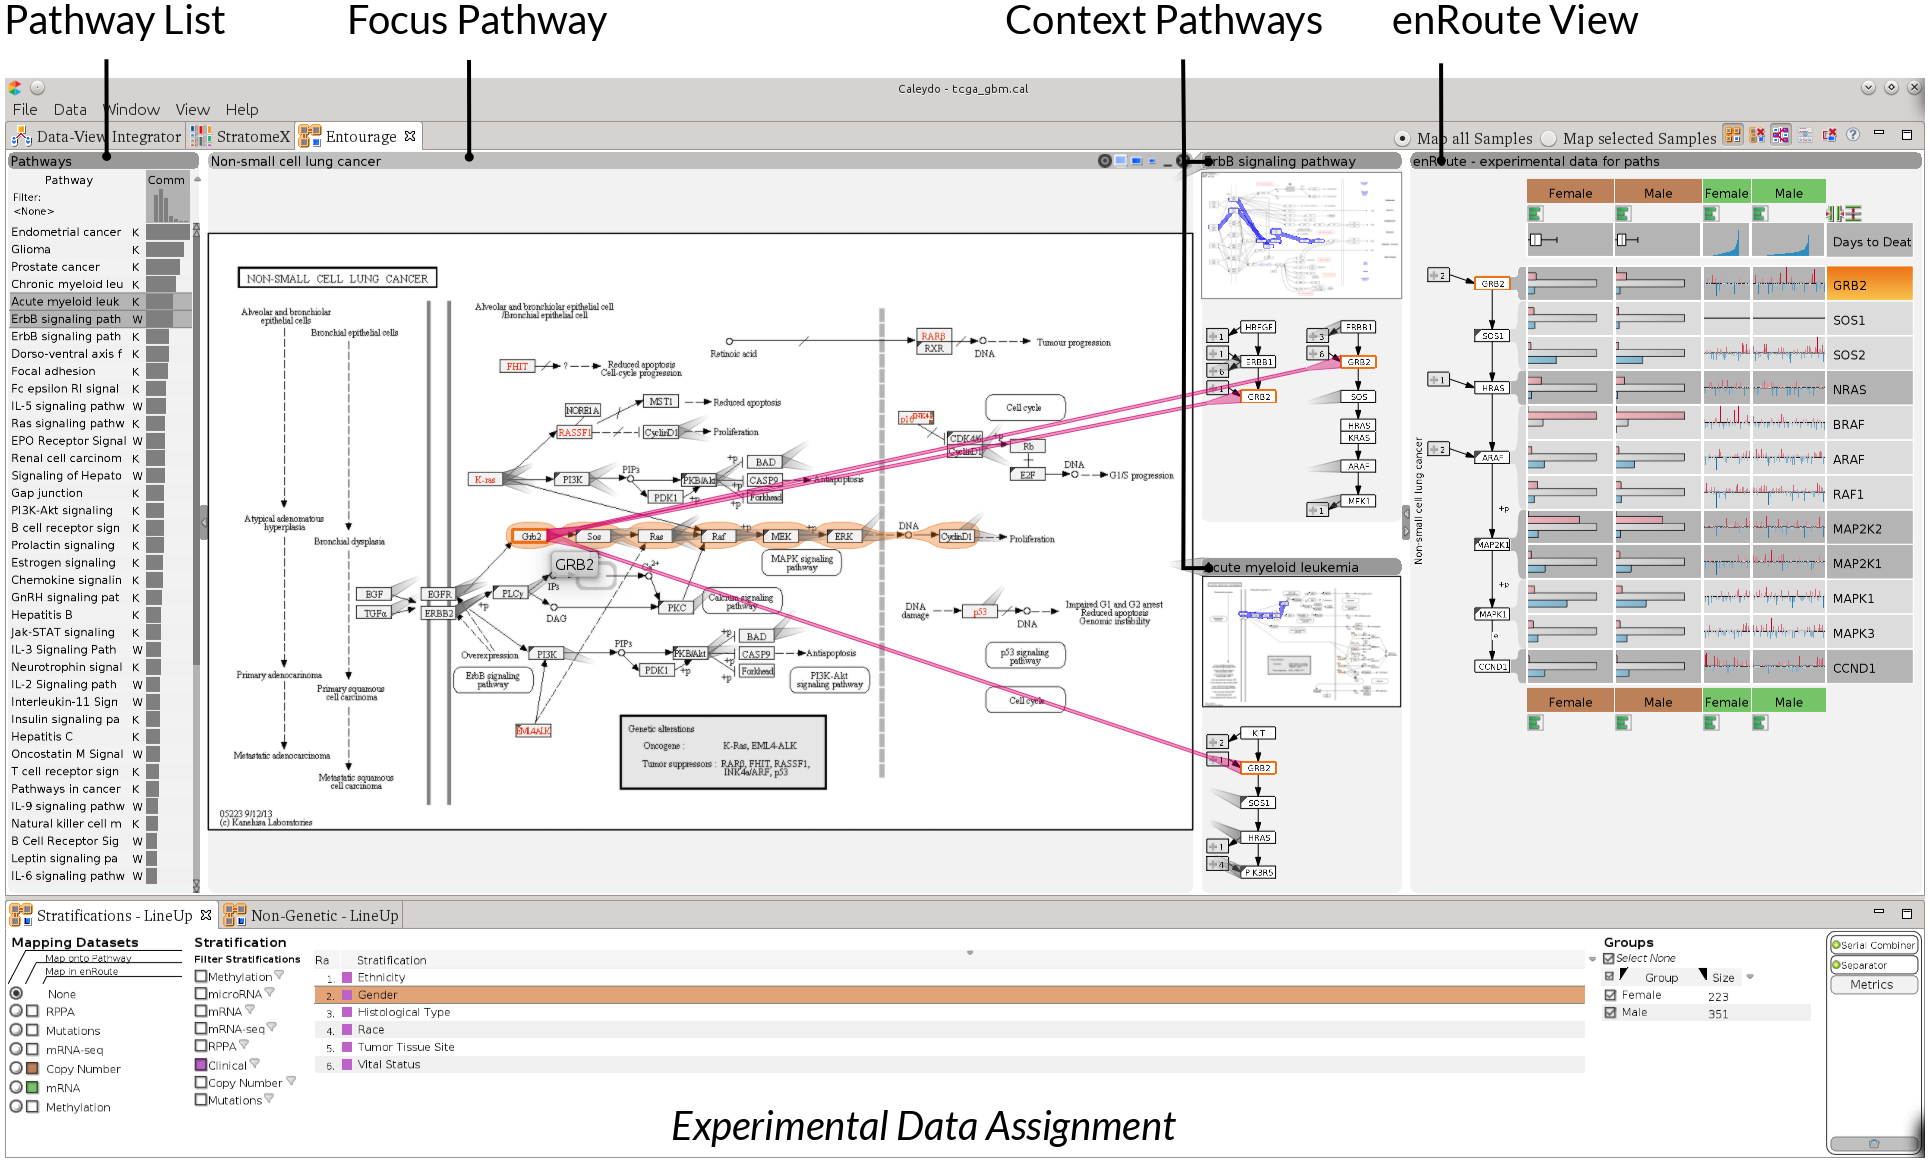
enRoute and Entourage are integrated into one comprehensive visualization system that includes interfaces to select and rank pathways as well as to choose datasets and groupings to map onto the pathways or to display in enRoute, as shown in the following figure.