Abstract
Multivariate, tabular data is one of the most common data structures used in many different domains.
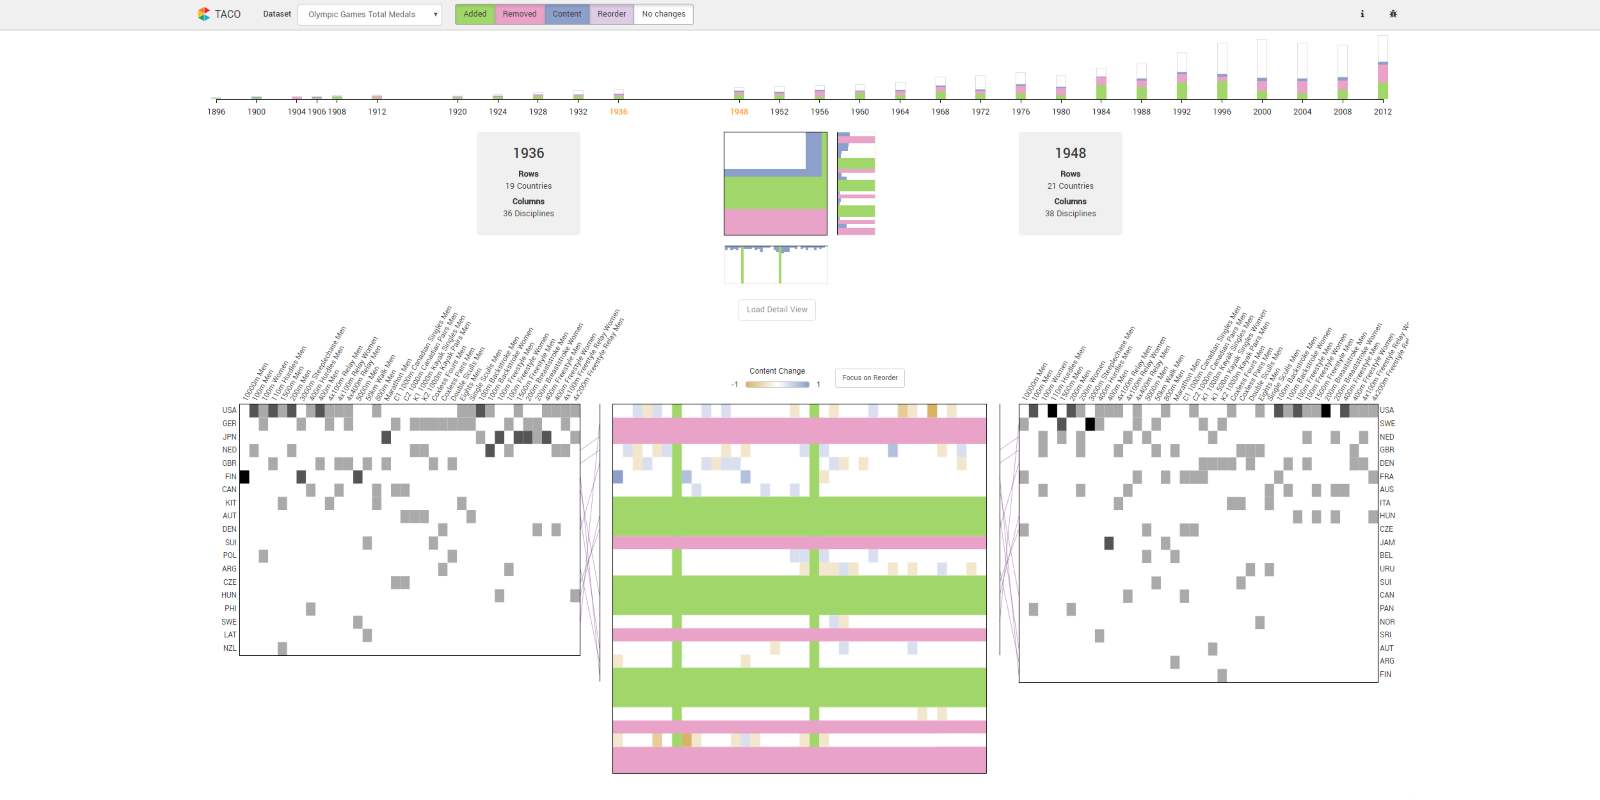
Over time, tables can undergo changes in both structure and content, which results in multiple versions of the same table. A challenging task when working with such derived tables is to understand what exactly has changed between versions in terms of additions/deletions, reorder, merge/split, and content changes. For textual data, a variety of commonplace "diff" tools exist that support the task of investigating changes between revisions of a text. Although there are some comparison tools which assist users in inspecting differences between multiple table instances, the resulting visualizations are often difficult to interpret or do not scale to large tables with thousands of rows and columns.
To address these challenges, we developed TACO, an interactive comparison tool that visualizes effectively the differences between multiple tables at various levels of detail. With TACO we show (1) the aggregated differences between multiple table versions over time, (2) the aggregated changes between two selected table versions, and (3) detailed changes between the selection. To demonstrate the effectiveness of our approach, we show its application by means of two usage scenarios.
Citation
Christina Niederer,
Holger
Stitz,
Reem Hourieh,
Florian Grassinger,
Wolfgang Aigner,
Marc
Streit
TACO: Visualizing Changes in Tables Over Time
IEEE Transactions on Visualization and Computer Graphics (InfoVis '17),
24(1):
677-686, doi:10.1109/TVCG.2017.2745298, 2018.
BibTeX
@article{2017_infovis_taco,
    title = {TACO: Visualizing Changes in Tables Over Time},
    author = {Christina Niederer and Holger Stitz and Reem Hourieh and Florian Grassinger and Wolfgang Aigner and Marc Streit},
    journal = {IEEE Transactions on Visualization and Computer Graphics (InfoVis '17)},
    doi = {10.1109/TVCG.2017.2745298},
    volume = {24},
    number = {1},
    pages = {677-686},
    year = {2018}
}
Acknowledgements
We want to thank Samuel Gratzl for his contributions made during all phases of the project as well as to the implementation of the prototype system. We would also like to thank Nils Gehlenborg for giving domain specific input on the biomedical usage scenario and for providing feedback on the prototype implementation and its potential value for domain experts. This work was funded by the Austrian Science Fund as part of the VisOnFire project (FWF P27975-NBL), the State of Upper Austria (FFG 851460), and the Austrian Ministry for Transport, Innovation and Technology (BMVIT) under the ICT of the future program via the VALiD project (FFG 845598).