Abstract
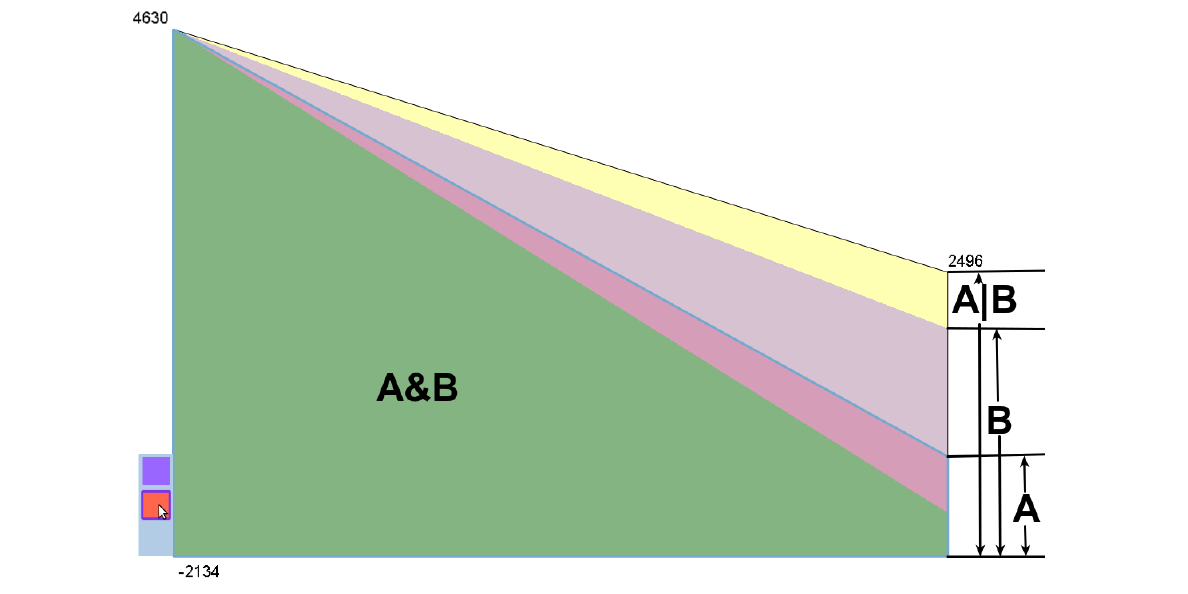
Filtering data is an essential process in a drill-down analysis of large data sets. Filtering can be necessary for several reasons. The main objective for filters is to uncover the relevant subsets of a dataset. Another, equally relevant goal is to reduce a dataset to dimensions to which either visualization or algorithmic analysis techniques scale. However, with multiple filters applied and possibly even logically combined, it becomes difficult for users to judge the effects of a filter chain. In this paper we present a simple, yet effective way to interactively visualize a sequence of filters and logical combinations of these. Such a visualized filter-pipeline allows analysts to easily judge the effect of every single filter and also their combination on the data set under investigation and therefore, leads to a faster and more efficient workflow. We also present an implementation of the proposed technique in an information visualization framework for the life sciences. The technique, however, could be employed in many other information visualization contexts as well.
Citation
Thomas Geymayer,
Alexander Lex,
Marc
Streit,
Dieter Schmalstieg
Visualizing the Effects of Logically Combined Filters
Proceedings of the Conference on Information Visualisation (IV '11),
47--52, doi:10.1109/IV.2011.52, 2011.
BibTeX
@inproceedings{2011_iv_filter-pipeline,
    title = {Visualizing the Effects of Logically Combined Filters},
    author = {Thomas Geymayer and Alexander Lex and Marc Streit and Dieter Schmalstieg},
    booktitle = {Proceedings of the Conference on Information Visualisation (IV '11)},
    publisher = {IEEE Computer Society Press},
    doi = {10.1109/IV.2011.52},
    pages = {47--52},
    year = {2011}
}

