Abstract
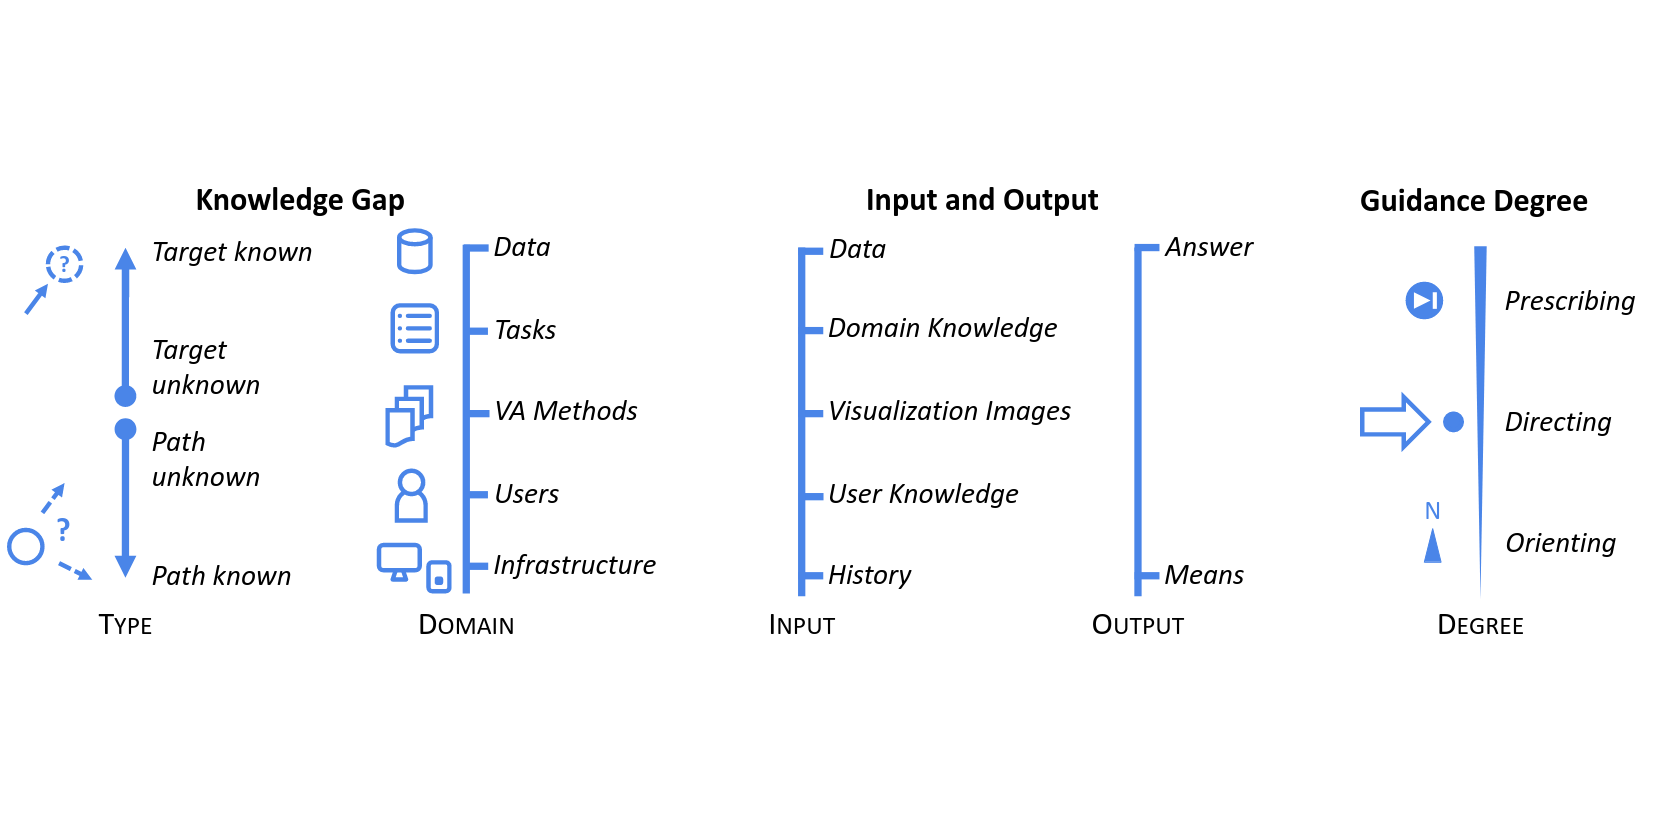
Visual analytics (VA) is typically applied in scenarios where complex data has to be analyzed. Unfortunately, there is a natural correlation between the complexity of the data and the complexity of the tools to study them. An adverse effect of complicated tools is that analytical goals are more difficult to reach. Therefore, it makes sense to consider methods that guide or assist users in the visual analysis process. Several such methods already exist in the literature, yet we are lacking a general model that facilitates in-depth reasoning about guidance. We establish such a model by extending van Wijk’s model of visualization with the fundamental components of guidance. Guidance is defined as a process that gradually narrows the gap that hinders effective continuation of the data analysis. We describe diverse inputs based on which guidance can be generated and discuss different degrees of guidance and means to incorporate guidance into VA tools. We use existing guidance approaches from the literature to illustrate the various aspects of our model. As a conclusion, we identify research challenges and suggest directions for future studies. With our work we take a necessary step to pave the way to a systematic development of guidance techniques that effectively support users in the context of VA.
Citation
Davide Ceneda,
Theresia Gschwandtner,
Thorsten May,
Silvia Miksch,
Hans-Jörg Schulz,
Marc
Streit,
Christian Tominski
Characterizing Guidance in Visual Analytics
IEEE Transactions on Visualization and Computer Graphics (VAST '16),
23(1):
111--120, doi:10.1109/TVCG.2016.2598468, 2017.
BibTeX
@article{2016_vast_guidance,
    title = {Characterizing Guidance in Visual Analytics},
    author = {Davide Ceneda and Theresia Gschwandtner and Thorsten May and Silvia Miksch and Hans-Jörg Schulz and Marc Streit and Christian Tominski},
    journal = {IEEE Transactions on Visualization and Computer Graphics (VAST '16)},
    doi = {10.1109/TVCG.2016.2598468},
    volume = {23},
    number = {1},
    pages = {111--120},
    year = {2017}
}
Acknowledgements
We thank the participants of the Rostock Workshop on Emerging Topics in Visualization and Computer Graphics 2013 (WET-VCG) for valuable initial discussions on guidance. The presented research drew inspiration from the Dagstuhl Seminar 13352 on Interaction with Information for Visual Reasoning. This work was supported by the Centre for Visual Analytics Science and Technology CVAST, funded by the Austrian Federal Ministry of Science, Research, and Economy in the exceptional Laura Bassi Centres of Excellence initiative (#822746). Further support has been received from the State of Upper Austria under grant number (FFG #851460). Finally, we thank the anonymous reviewers for their helpful comments and valuable feedback.