Abstract
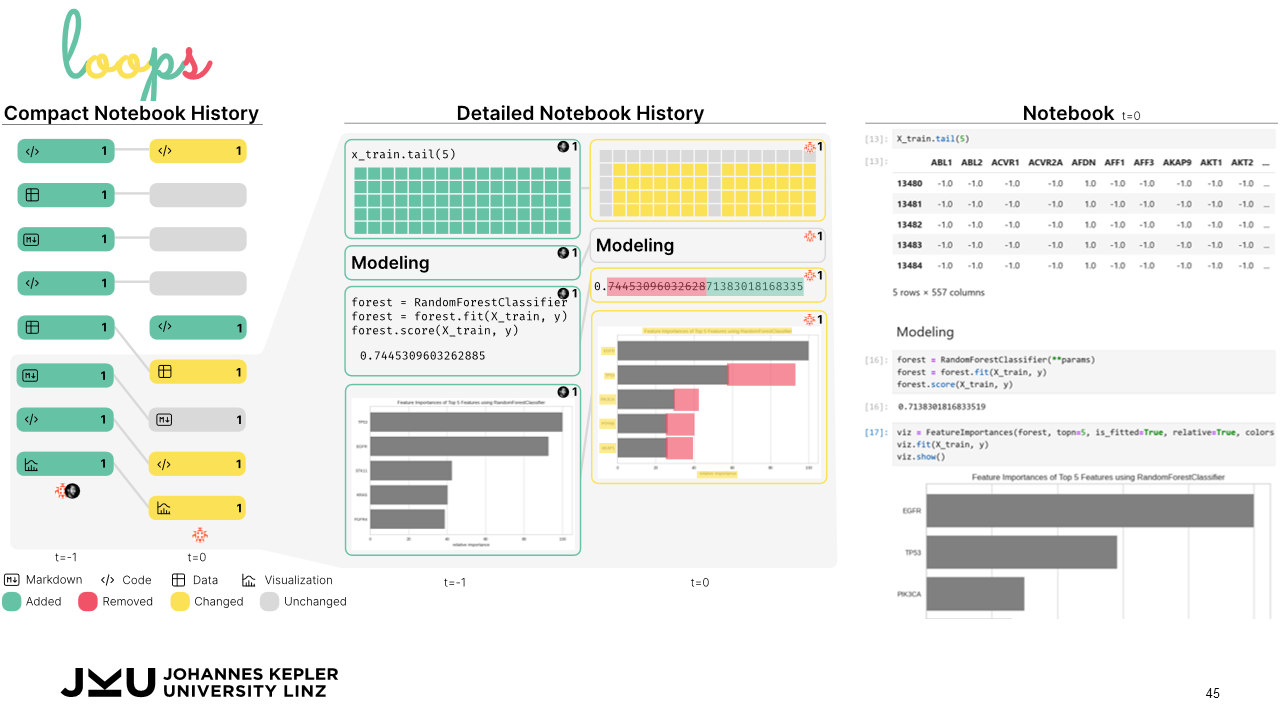
Exploratory data science is an iterative process of obtaining, cleaning, profiling, analyzing, and interpreting data. This cyclical way of working creates challenges within the linear structure of computational notebooks, leading to issues with code quality, recall, and reproducibility. To remedy this, we present Loops, a set of visual support techniques for iterative and exploratory data analysis in computational notebooks. Loops leverages provenance information to visualize the impact of changes made within a notebook. In visualizations of the notebook provenance, we trace the evolution of the notebook over time and highlight differences between versions. Loops visualizes the provenance of code, markdown, tables, visualizations, and images and their respective differences. Analysts can explore these differences in detail in a separate view. Loops not only makes the analysis process transparent but also supports analysts in their data science work by showing the effects of changes and facilitating comparison of multiple versions. We demonstrate our approach's utility and potential impact in two use cases and feedback from notebook users from various backgrounds. This paper and all supplemental materials are available at https://osf.io/79eyn.
Citation
Klaus
Eckelt,
Kiran Gadhave,
Alexander Lex,
Marc
Streit
Loops: Leveraging Provenance and Visualization to Support Exploratory Data Analysis in Notebooks
IEEE Transactions on Visualization and Computer Graphics,
31(1):
1213-1223, doi:10.1109/TVCG.2024.3456186, 2024.
BibTeX
@article{2024_loops,
    title = {Loops: Leveraging Provenance and Visualization to Support Exploratory Data Analysis in Notebooks},
    author = {Klaus Eckelt and Kiran Gadhave and Alexander Lex and Marc Streit},
    journal = {IEEE Transactions on Visualization and Computer Graphics},
    doi = {10.1109/TVCG.2024.3456186},
    volume = {31},
    number = {1},
    pages = {1213-1223},
    year = {2024}
}


