Abstract
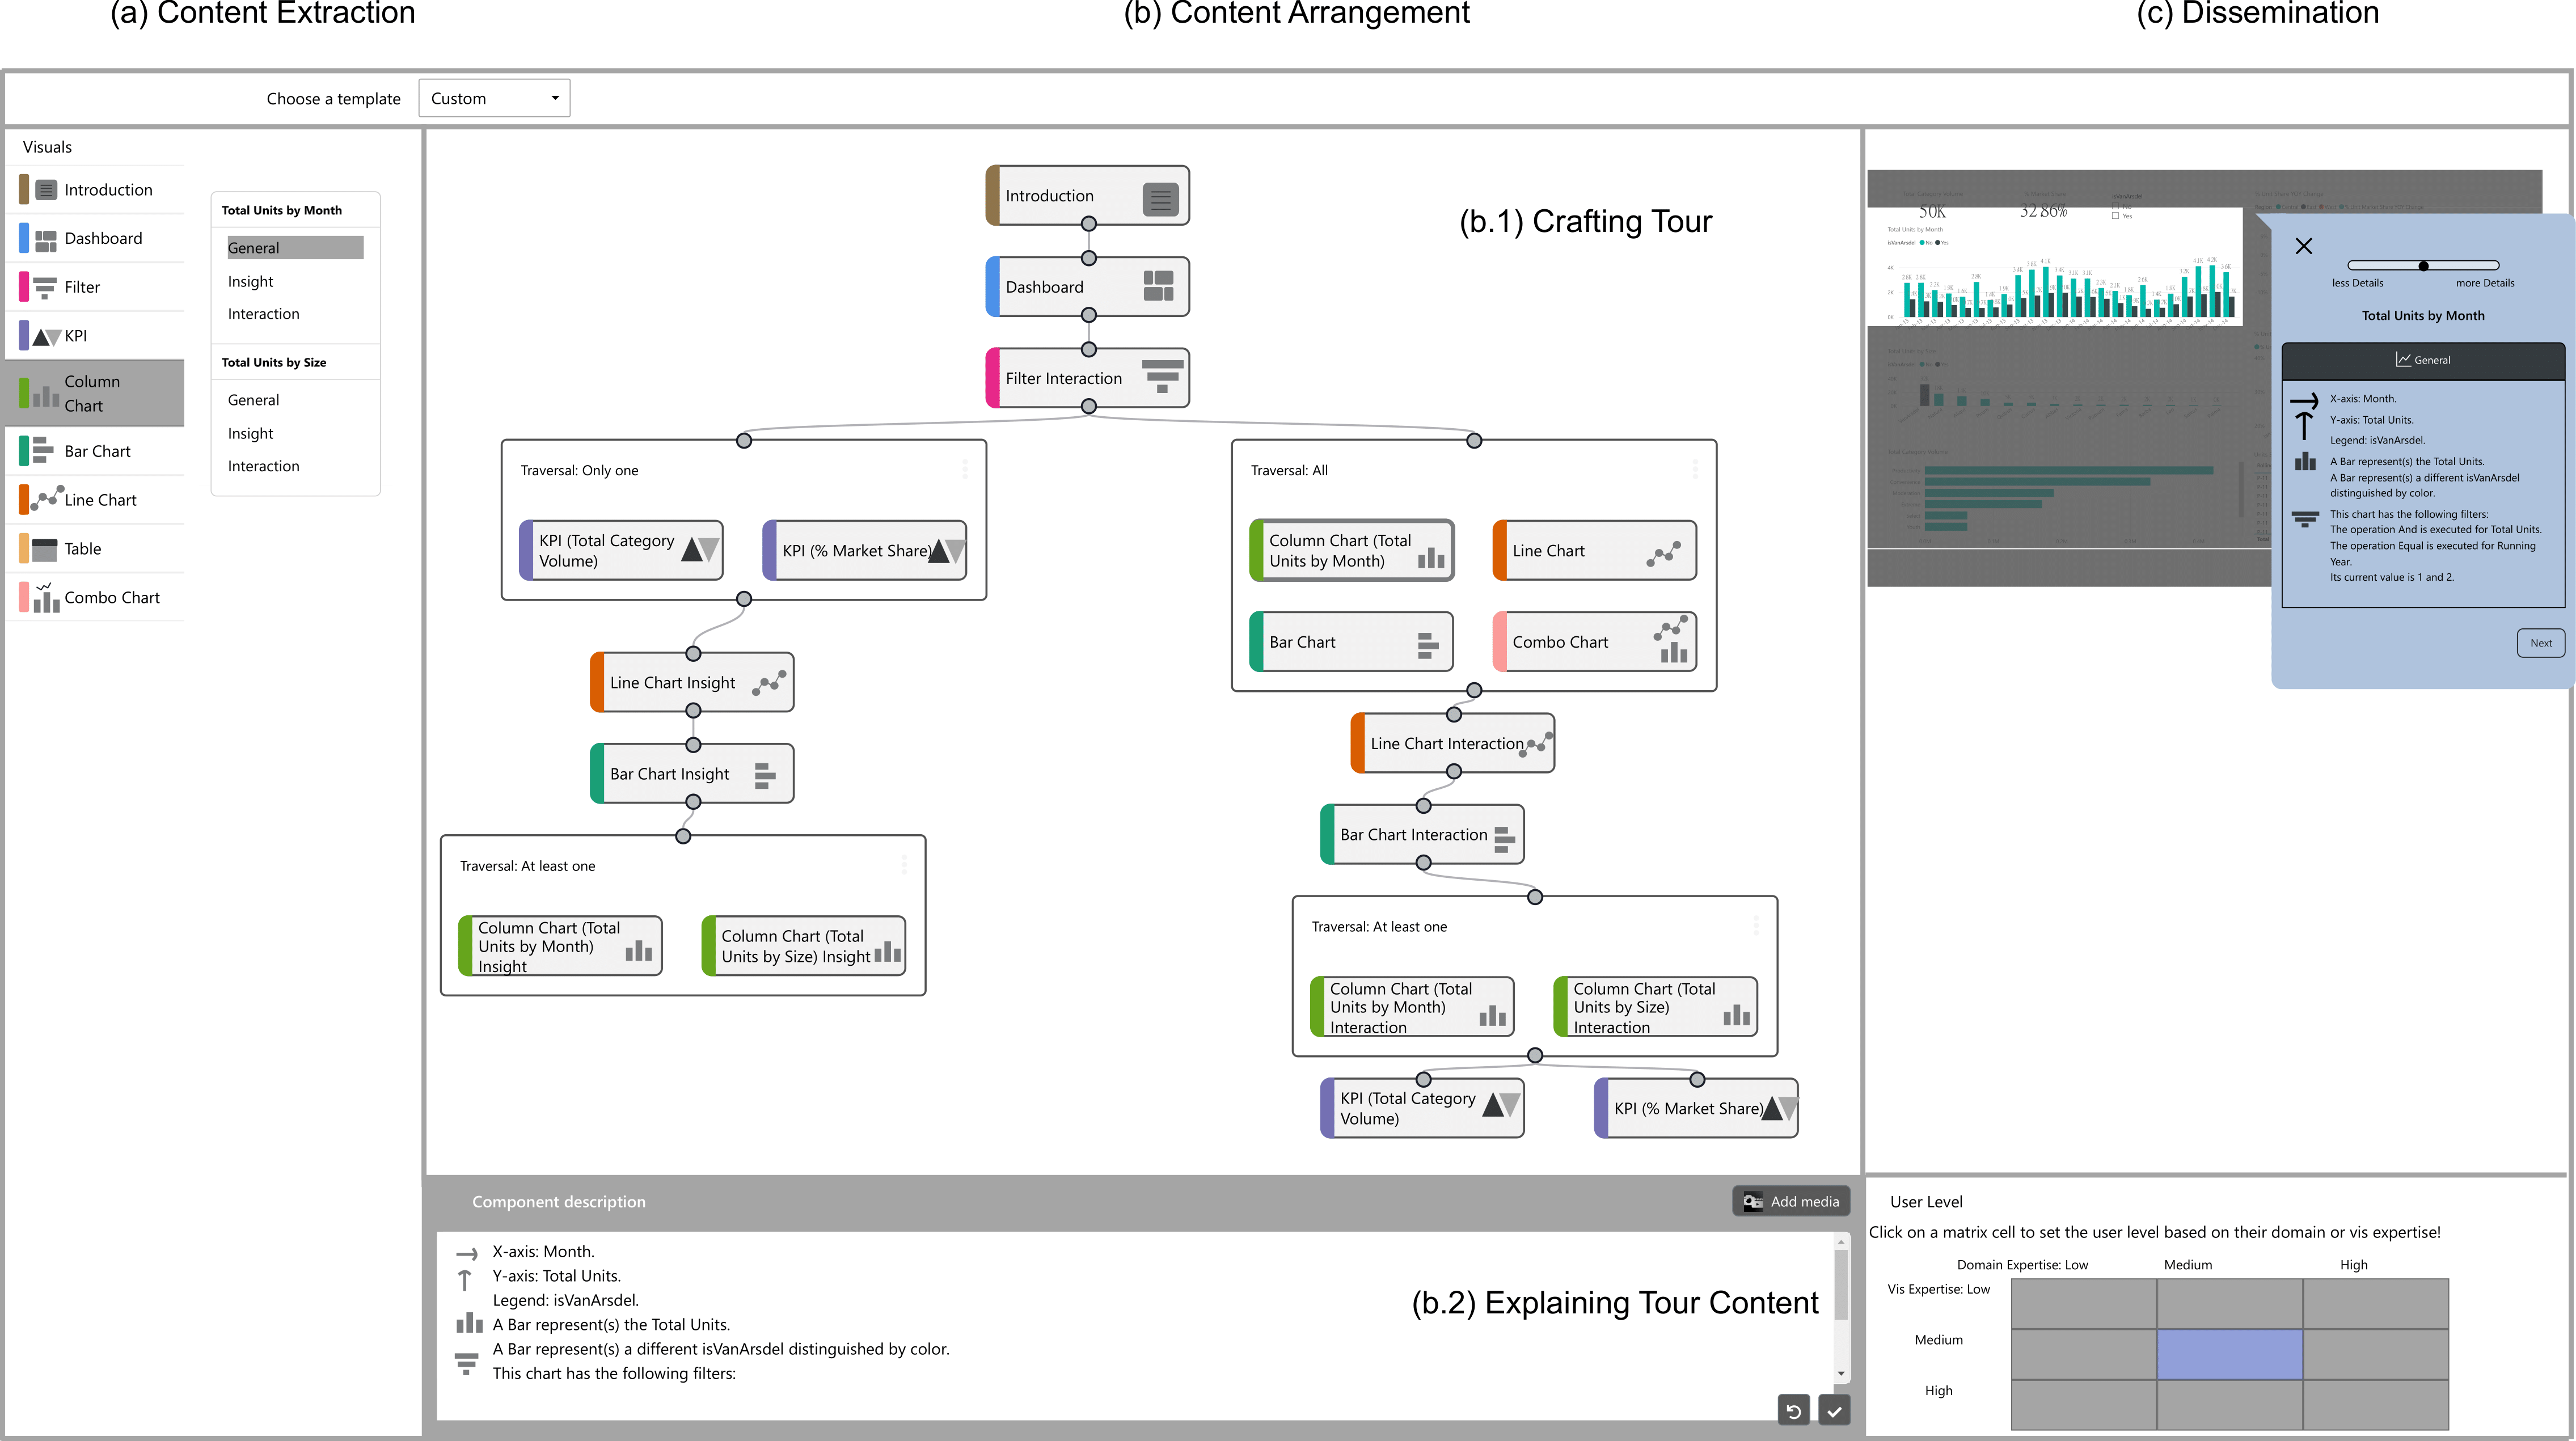
Onboarding a user to a visualization dashboard entails explaining its various components, including the chart types used, the data loaded, and the interactions available. Authoring such an onboarding experience is time-consuming and requires significant knowledge, and little guidance exists on how best to complete this task. Depending on their levels of expertise, end users being onboarded to a new dashboard can be either confused and overwhelmed or disinterested and disengaged. We propose interactive dashboard tours (D-Tours) as semi-automated onboarding experiences that preserve the agency of users with various levels of expertise to keep them interested and engaged. Our interactive tours concept draws from open-world game design to give the user freedom in choosing their path through onboarding. We have implemented the d-tour concept in a tool called D-Tour Prototype, which allows authors to craft custom d-tours from scratch or using automatic templates. Automatically generated tours can still be customized to use different media (e.g., video, audio, and highlighting) or new narratives to produce an onboarding experience tailored to an individual user. We demonstrate the usefulness of d-tours through use cases and expert interviews. Our evaluation shows that authors found the automation in the D-Tour Prototype helpful and time-saving, and users found the created tours engaging and intuitive. This paper and all supplemental materials are available at https://osf.io/6fbjp/.
Citation
Vaishali
Dhanoa,
Andreas
Hinterreiter,
Vanessa Fediuk,
Niklas Elmqvist,
Eduard Gröller,
Marc
Streit
D-Tour: Semi-Automatic Generation of Interactive Guided Tours forVisualization Dashboard Onboarding
IEEE Transactions on Visualization and Computer Graphics,
doi:10.31219/osf.io/t5m3u, 2024.
BibTeX
@article{2024_d_tour,
    title = {D-Tour: Semi-Automatic Generation of Interactive Guided Tours forVisualization Dashboard Onboarding},
    author = {Vaishali Dhanoa and Andreas Hinterreiter and Vanessa Fediuk and Niklas Elmqvist and Eduard Gröller and Marc Streit},
    journal = {IEEE Transactions on Visualization and Computer Graphics},
    publisher = {IEEE Computer Society},
    doi = {10.31219/osf.io/t5m3u},
    url = {https://osf.io/preprints/osf/t5m3u},
    year = {2024}
}
Acknowledgements
We thank Ivaletta Shakhova from Technical University, Vienna, for her contribution and support in the design and development of the D-Tour Prototype. This work was supported by the Austrian Science Fund (FWF DFH 23–N), Villum Fonden (Villum Investigator grant VL-54492, Denmark), and the Austrian Research Promotion Agency (FFG 881844, FFG 879730). Any opinions, findings, and conclusions or recommendations expressed here are those of the authors and do not necessarily reflect the views of the funding agencies.