Abstract
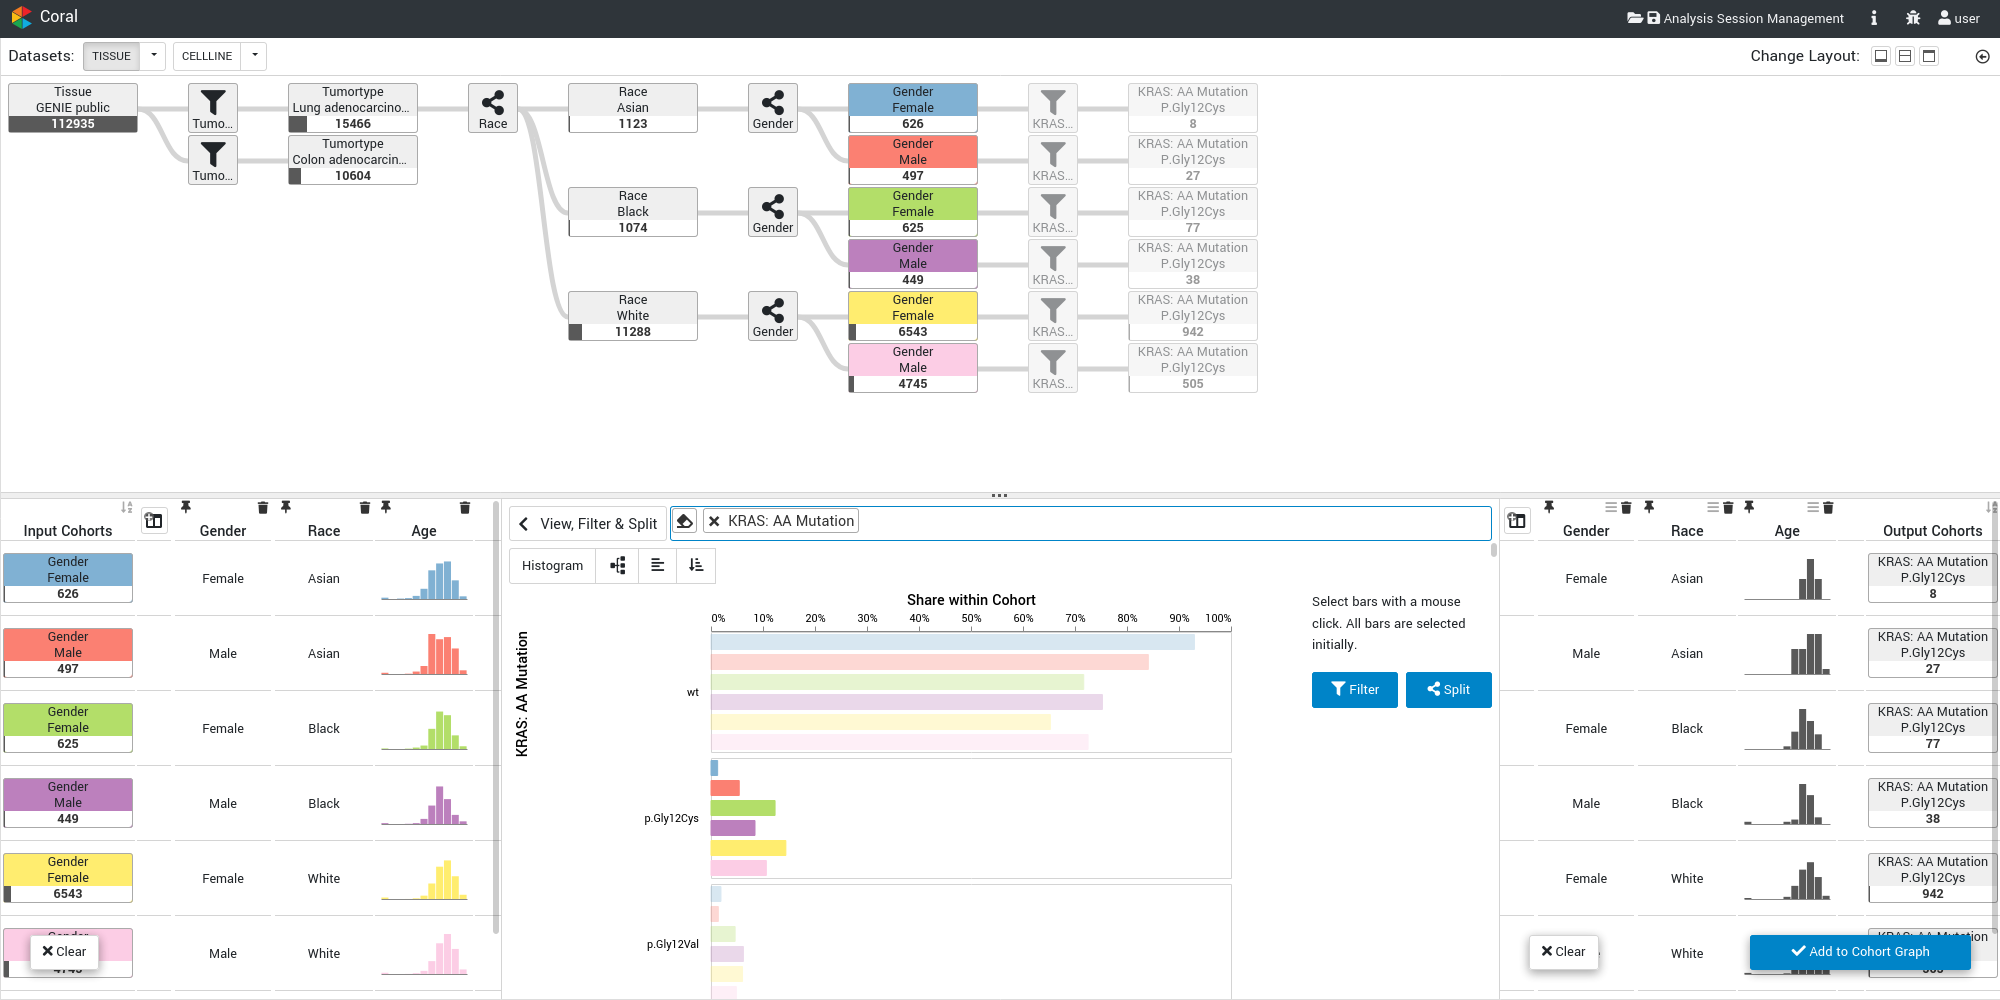
A main task in computational cancer analysis is the identification of patient subgroups (i.e., cohorts) based on metadata attributes (patient stratification) or genomic markers of response (biomarkers). Coral is a web-based cohort analysis tool that is designed to support this task: Users can interactively create and refine cohorts, which can then be compared, characterized, and inspected down to the level of single items. We visualize the evolution of cohorts and also provide intuitive access to prevalence information. Coral can be utilized to explore any type of cohort and sample set. Here, we focus on the analysis of genomic data from cancer patients and therefore included in the public version data from the AACR Project GENIE, The Cancer Genome Atlas, and the Cell Line Encyclopedia.
Citation
Patrick
Adelberger,
Klaus
Eckelt,
Markus J. Bauer,
Marc
Streit,
Christian Haslinger,
Thomas Zichner
Coral: a web-based visual analysis tool for creating and characterizing cohorts
Bioinformatics,
37(23):
4559-4561, doi:10.1093/bioinformatics/btab695, 2021.
BibTeX
@article{2021_bioinformatics_coral,
    title = {Coral: a web-based visual analysis tool for creating and characterizing cohorts},
    author = {Patrick Adelberger and Klaus Eckelt and Markus J. Bauer and Marc Streit and Christian Haslinger and Thomas Zichner},
    journal = {Bioinformatics},
    publisher = {Oxford University Press},
    doi = {10.1093/bioinformatics/btab695},
    volume = {37},
    number = {23},
    pages = {4559-4561},
    month = {12},
    year = {2021}
}
Acknowledgements
We thank Andreas Wernitznig, Alex Lex, and the datavisyn GmbH team, in particular Holger Stitz, for their feedback and implementation support. The authors acknowledge the American Association for Cancer Research and its financial and material support in the development of the AACR Project GENIE registry, and members of the consortium for their commitment to open data. Interpretations are the responsibility of study authors.


