We develop tools for interactive data visualization. Here is a list of tools that you can use either by downloading a piece of software, or by going to a website.
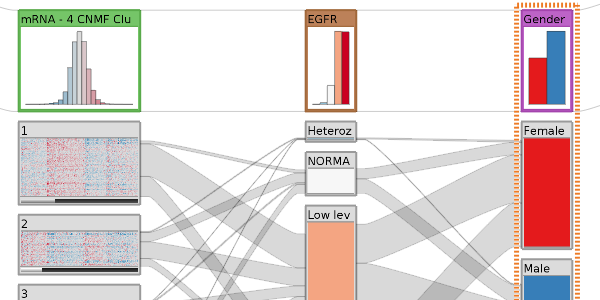
Genomic Stratification of Diseases
Integrative visualization of stratified heterogeneous data for disease subtype analysis.
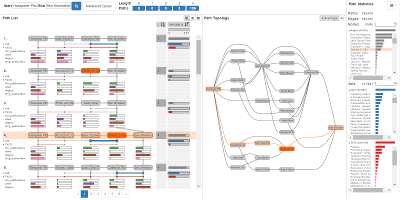
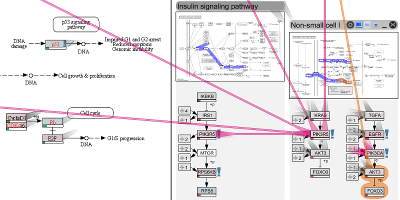
Experimental Data in Pathways
Visualizing large & heterogeneous experimental data with enRoute and pathway interdependencies with Entourage.
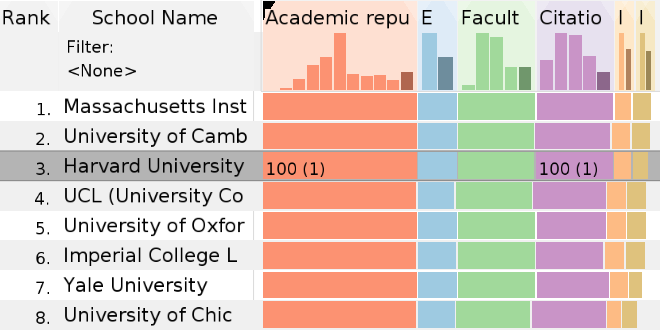
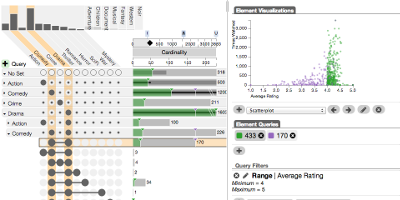
Multi-Attribute Rankings
LineUp is an interactive technique designed to create, visualize and explore rankings of items based on a set of heterogeneous attributes.
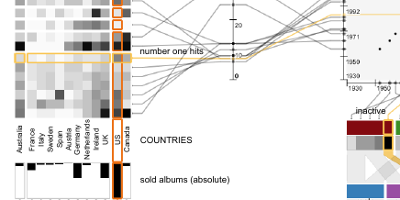
Exploring Subsets of Tabular Datasets
Extracting, Comparing, and Manipulating Subsets across Multiple Tabular Datasets
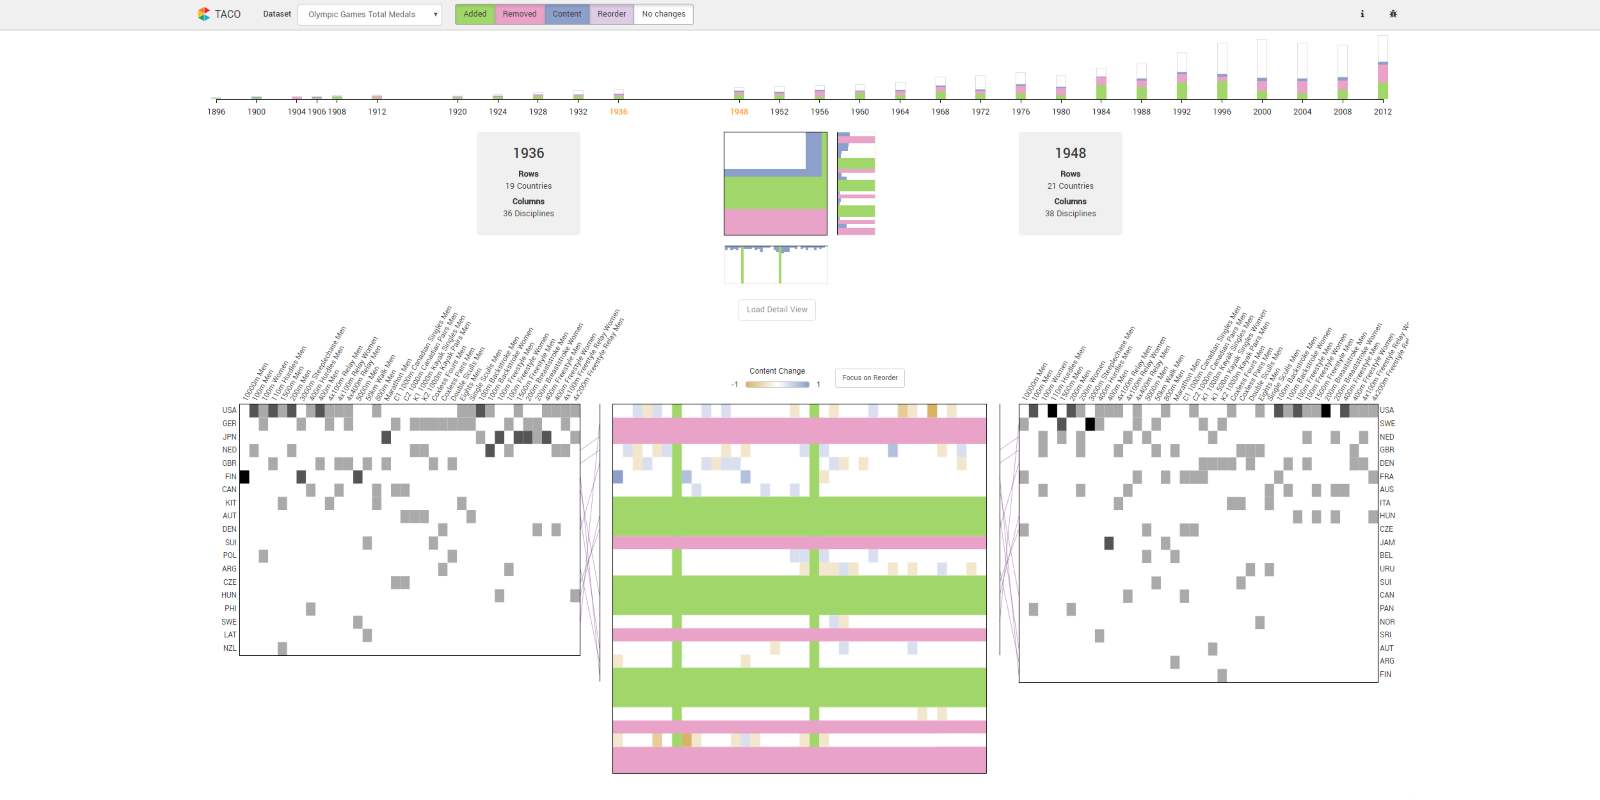
Visualizing Changes in Tables Over Time
Visualize the differences between multiple tables at various levels of detail.