Abstract
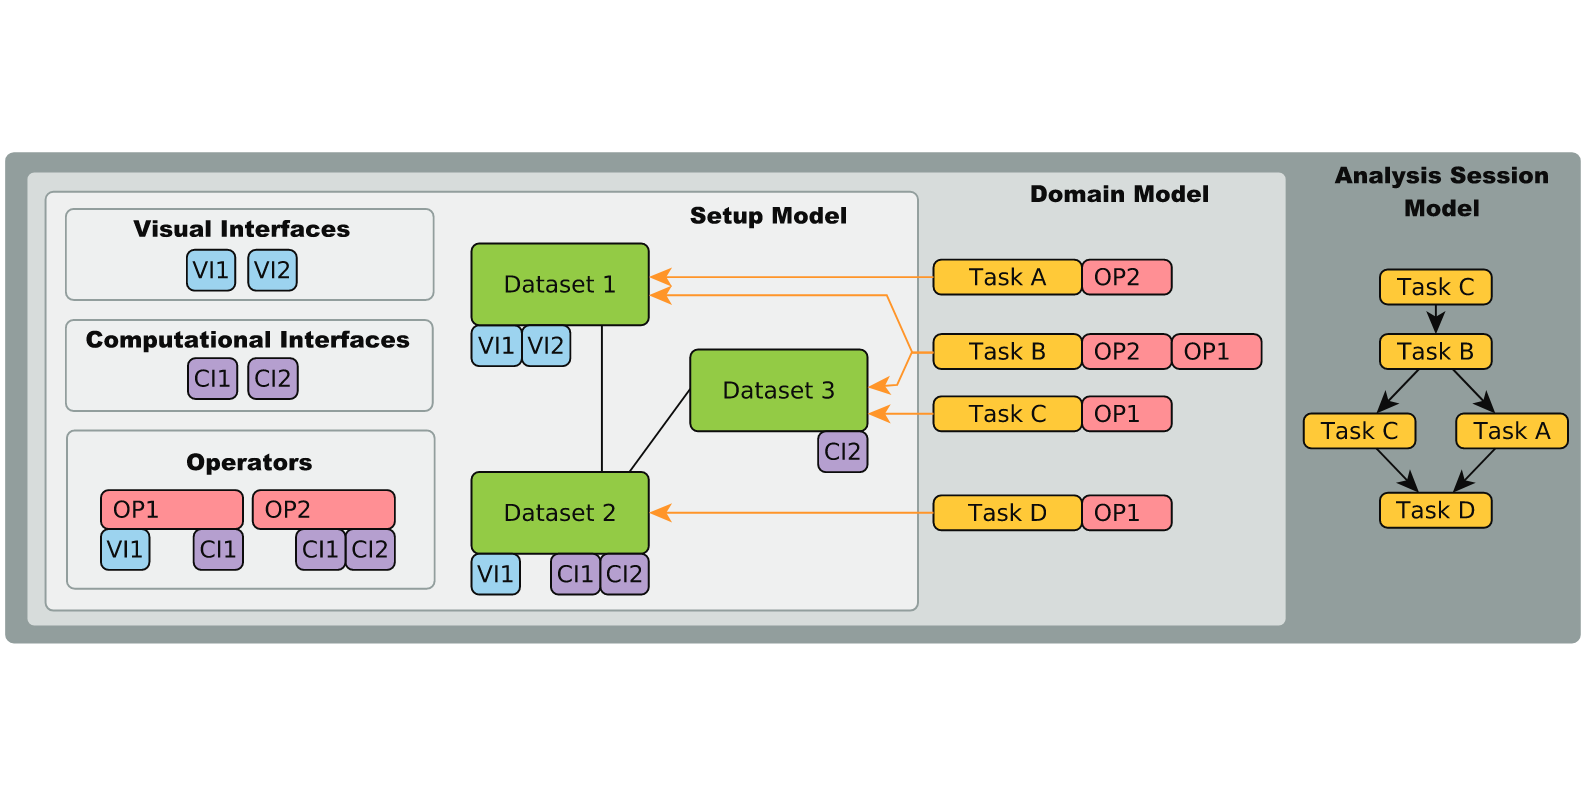
As heterogeneous data from different sources are being increasingly linked, it becomes difficult for users to understand how the data are connected, to identify what means are suitable to analyze a given data set, or to find out how to proceed for a given analysis task. We target this challenge with a new model-driven design process that effectively codesigns aspects of data, view, analytics, and tasks. We achieve this by using the workflow of the analysis task as a trajectory through data, interactive views, and analytical processes. The benefits for the analysis session go well beyond the pure selection of appropriate data sets and range from providing orientation or even guidance along a preferred analysis path to a potential overall speedup, allowing data to be fetched ahead of time. We illustrate the design process for a biomedical use case that aims at determining a treatment plan for cancer patients from the visual analysis of a large, heterogeneous clinical data pool. As an example for how to apply the comprehensive design approach, we present Stack’n’flip, a sample implementation which tightly integrates visualizations of the actual data with a map of available data sets, views, and tasks, thus capturing and communicating the analytical workflow through the required data sets.
Citation
Marc
Streit,
Hans-Jörg Schulz,
Alexander Lex,
Dieter Schmalstieg,
Heidrun Schumann
Model-Driven Design for the Visual Analysis of Heterogeneous Data
IEEE Transactions on Visualization and Computer Graphics,
18(6):
998--1010, doi:10.1109/TVCG.2011.108, 2012.
BibTeX
@article{2012_tvcg_model-driven,
    title = {Model-Driven Design for the Visual Analysis of Heterogeneous Data },
    author = {Marc Streit and Hans-Jörg Schulz and Alexander Lex and Dieter Schmalstieg and Heidrun Schumann},
    journal = {IEEE Transactions on Visualization and Computer Graphics},
    doi = {10.1109/TVCG.2011.108},
    volume = {18},
    number = {6},
    pages = {998--1010},
    year = {2012}
}

