Abstract
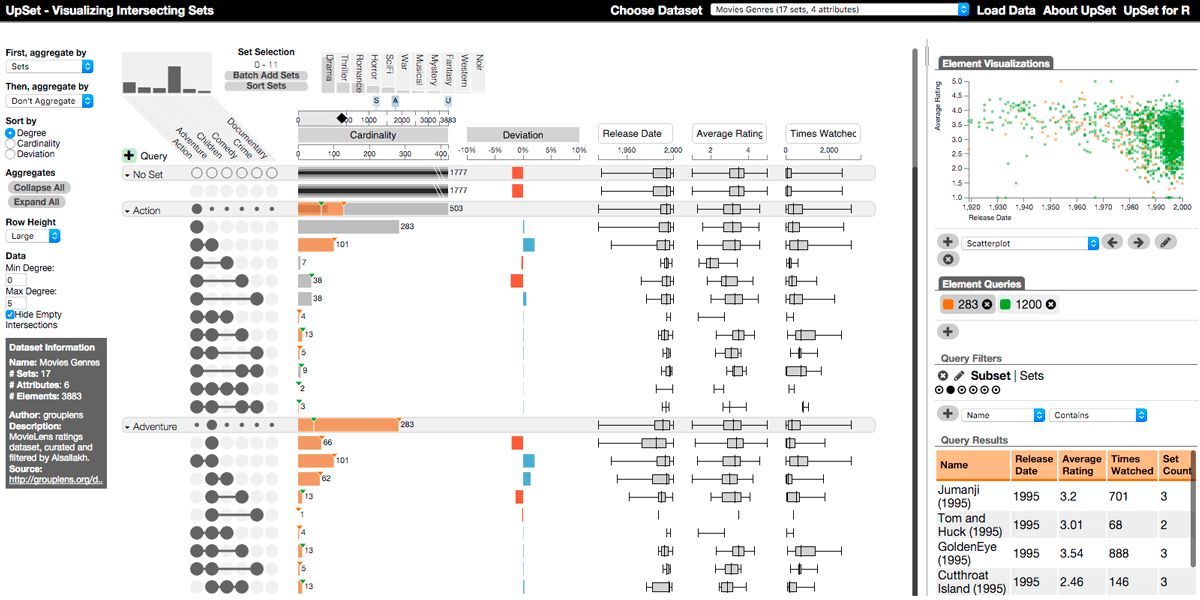
Understanding relationships between sets is an important analysis task that has received widespread attention in the visualization community. The major challenge in this context is the combinatorial explosion of the number of set intersections if the number of sets exceeds a trivial threshold. In this paper we introduce UpSet, a novel visualization technique for the quantitative analysis of sets, their intersections, and aggregates of intersections. UpSet is focused on creating task-driven aggregates, communicating the size and properties of aggregates and intersections, and a duality between the visualization of the elements in a dataset and their set membership. UpSet visualizes set intersections in a matrix layout and introduces aggregates based on groupings and queries. The matrix layout enables the effective representation of associated data, such as the number of elements in the aggregates and intersections, as well as additional summary statistics derived from subset or element attributes. Sorting according to various measures enables a task-driven analysis of relevant intersections and aggregates. The elements represented in the sets and their associated attributes are visualized in a separate view. Queries based on containment in specific intersections, aggregates or driven by attribute filters are propagated between both views. We also introduce several advanced visual encodings and interaction methods to overcome the problems of varying scales and to address scalability. UpSet is web-based and open source. We demonstrate its general utility in multiple use cases from various domains.
Citation
Alexander Lex,
Nils Gehlenborg,
Hendrik Strobelt,
Romain Vuillemot,
Hanspeter Pfister
UpSet: Visualization of Intersecting Sets
IEEE Transactions on Visualization and Computer Graphics (InfoVis '14),
20(12):
1983--1992, doi:10.1109/TVCG.2014.2346248, 2014.
BibTeX
@article{2014_infovis_upset,
    title = {UpSet: Visualization of Intersecting Sets},
    author = {Alexander Lex and Nils Gehlenborg and Hendrik Strobelt and Romain Vuillemot and Hanspeter Pfister},
    journal = {IEEE Transactions on Visualization and Computer Graphics (InfoVis '14)},
    doi = {10.1109/TVCG.2014.2346248},
    volume = {20},
    number = {12},
    pages = {1983--1992},
    year = {2014}
}
UpSet R Version
We have created a static version of UpSet for R called UpSetR. This can be used to create high-resolution UpSet plots for a paper or other publication.
UpSetR offers much of the same functionality as the interactive version but is adapted to the needs of a static representation. The R package is available on GitHub and released versions are hosted also on CRAN.
Acknowledgements
We wish to thank our collaborators, Anne Mai Wassermann, Soohyun Lee, Michele Coscia and Frank Neffke for their time and expertise. We also thank Bilal Alsallakh, Silvia Miksch and the whole Radial Sets team for providing feedback and datasets.
UpSet is supported in part by the Austrian Science Fund (J 3437-N15), the Air Force Research Laboratory and DARPA grant FA8750-12-C-0300 and the United States NIH/National Human Genome Research Institute (K99 HG007583).